I was looking for some mobile data / infographics on COVID19 in Portugal.
Didn’t find one, so I made one. Will be updating once a day. Share it if you want.
8 Likes
I´m making infographics on the corona virus. So, if you´re interested - among others:
• how the test works
• a timeline
• a map with current figures of infections in germany
8 Likes
Nice … I saw you are pulling live data from https://d30slvg82xq0j0.cloudfront.net/webgrafik/items/syncLabWebg/states-germany-rki.json
How often is that updated and what is the source? Best regards
Data is beeing pulled from the Robert Koch-Institut. Unfortunately they are updating only once a day.

For those who are interested - tow more examples of infographics on that topic:
Comparison of contagious diseases - shows, how many people one infected person infects on base of the Basic Reproduction Number R0 (for different diseases).
Covid-19: The most affected countries - shows current figures of corona infections worldwide.
This graphic doesn´t look very spectacular, but I learned a lot… It´s generated completely dynamically on base of an XML data file and is updated every hour. And - of course - formatting numbers using javaScript  (216 722 instead of 216722)
7 Likes
Connecting data from frequently updated sources
with a published hype file is what makes statistical infographics look professional, good job Kalle @ktewes !
Can you @ktewes please share your experience / insights on how to connect data from an XML /json file
(https://d30slvg82xq0j0.cloudfront.net/webgrafik/items/syncLabWebg/states-germany-rki.json) with hype file elements.
Unfortunately, this important topic isn't covered @Daniel in online documentation at all.
2 Likes
Well, I´m not a professional coder…  So I had to figure this out on myself in the last days and my solution might be not the way, the professionals among us would handle it… Certainly there are a couple of ways to accomplish this…
What I did or do is basically the following:
- Parse the XML or JSON
- Assign the XML/JSON-values to data attributes of Hype-Elements dynamically
(you know, this is what you can do in the Hype IDE manually:)
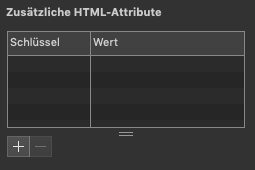
Once this is done, you´re free to do anything you want by selecting the data-attribute and process this data and transform it into visualisation …
Anyway - if you are little bit patient, I can set up an example file… (would give you the original project files, but they need a special environment, won´t work without…)
4 Likes
And here´s a simple example:
For this example I referenced a JSON file inside the library. This of course can be a JSON somewhere on any server.
- Loading of JSON and assigning data-attributes happens onLoad of the Hype file (loadJSON() )
- Visualisation happens inside each symbol (setupSymbol () - it´s a timeline event, it doesn´t work onLoad - Hype seems to need some time… a bug?)
- Question to the Pros: What can be made better - do you have more efficient approaches?
jsonExample_1.zip (21.6 KB)
2 Likes
Hi Kalle,
i did some previews on Desktopbrowsers and got failures on Chrome and Firefox on very first load. Any further load succeed.
The reason can be that you solved the XMLHttpRequest and later usage (animation …) independently.
It is not ensured that the dataattributes are in place before they are requested.
One solution would be to start a function from within the XMLHttpRequest to handle your asynchronous request, which would skip the timeline-event-approach …
///////////////////
this comment only affects the last example. i did not experience this with your great productiongraphics! just to mention 
1 Like
Thanks, Hans-Gerd, that´s a good point. Will have a look at that…
Hallo Kalle
Thank you very much for your insights and for the example file you've put together.
As I can see from your working example your approach is to omit the setup of the 'Additional HTML Attributes' -table and put everything into functions: loadJSON() + setupSymbol().
Looks like it may work either way, with a useful hint from Hans-Gerd:
Hi Kalle @ktewes
I like the functionality of your recent infographics.
I wonder, how did you create the Tooltips (info-boxes) in hype,
I assume with a help of some javascript snippet?
http://dpa-webgrafik.s3.amazonaws.com/webgrafik/items/wg_index/index_2020_03_11_coronaInfektionen.html
as well as here:
http://dpa-webgrafik.s3.amazonaws.com/webgrafik/items/wg_index/index_2020_03_29_coronaWelt.html
Thanks for sharing!
1 Like
Hei Ed,
yes, it´s a little bit of code, but once set up, your very flexible by using it. I don´t like the ‘Hype Way’ by using different timelines for the mouseover effects. This makes a lot of work and is difficult to handle with plenty of them …
Short description of the structure and what the functions do (please look at the comments in the Hype file):
onLoad: init()
- creates an array with all the boxes placed on the stage
onMouseOver: mOver()
- makes all text elements invisible
- calls alpha_40() (sets alpha of all box elements to 40 %)
- sets the alpha of hovered box element to 100%
- makes the according text element of the hovered box element visible
- fills in text
onMouseOut: mOut()
- makes all text elements invisible
- calls alpha_100() (sets alpha of all box elements to 100%)
In the mobile Version I just call mOver() on mouseDown and mOut() on mouseUp…
And as always - this works for me, others may have a different approach. Any suggestions of improvement welcome! (And I´m sure, there are…  )
)
mouseOver.zip (20.6 KB)
4 Likes
Hallo Kalle @ktewes
Thank you very much for sharing, for your thorough explanation
and for attaching a working file.
I really like that your js functions in the hype file are all //commented out.
To me, your approach is efficient and time-saving in comparison to
no-code way of doing it with timelines (a little bit of  business, the latter case).
Another question:
How to make Info-boxes (Tooltips) move with the cursor?
Here a screen recording of your online publication:
And I have my hype source file here:
map-us.hype.zip (33.9 KB)
the function pathcontrol() works so far,
but it uses jquery code with reference to css in the Head HTML,
which seems to be too heavy to combine with your code?
Maybe you’ve got a more compact /no-jquery solution for this Tooltip interactivity?
Best,
Ed
Hi Ed,
I´m using a variation of Jonathan´s code here. This works pretty neat.
As I see in your Example, the data is written directly into the map and it´s not dynamic. Using the code above you can detect the element´s id (since your example does not make use of classes) and you can handle it almost in the same way as you do with the mouseOver example.
1 Like
Thank you @ktewes for pointing out to the link, very helpful !
Hmmm, I think, this could be a possible solution?
jsonExample_2.zip (21.3 KB)
jsonExample_X.hype.zip (15.8 KB)
This is a quickshot…
I’d say that data-attributes are only necessary for further interactivity.
Means:
Load and set in one go and may inculde set up additional dataattributes for further interactivity which is happening after the first init … so there’s no need for reloads of the data …
2 Likes