… und wenn ich groß bin, lerne ich programmieren… 
2 Likes
ich auch 
3 Likes
Thank You for the demo! 
1 Like
Bravo, @h_classen thanks for a short and sweet solution! In der Kürze liegt die Würze…
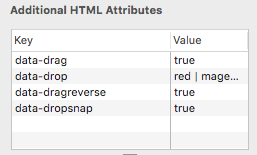
Next we have to learn how to tweak data-attributes for further interactivity.
this in fact is a wrong approach.
you should avoid unecessary code and repetitions, but first rule should always be to create readable and easy to debug code. which of course may/will lead to longer code ... ![]()
well @ktewes showed how to set and use data-attributes in his approach. so it's all there ...
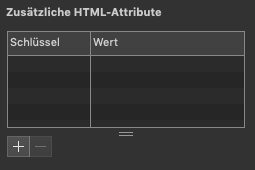
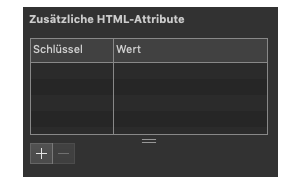
I see @h_classen that the table in @ktewes examples is empty,
but I have seen in your (other) projects that you make use of this table and fill data in. This table is a new thing for me, still have to learn how and when to use it.
Looks like the table is ment for more savvy developers.
1 Like
Hei Ed,
what I´m doing in the above examples is setting the data-attributes dynamically, via JS. You can do almost the same using the ‘table’ in the Hype IDE. Look at this example:
colorRectangle.zip (12.7 KB)
2 Likes
Hallo Kalle @ktewes ,
thanks alot for your visual example. Great to learn that there are more than one way/option for completing of the same task.
2 Likes
Can you please update the "Comparison of contagious diseases" for Delta variant? The variant is now almost as contagious as measles.