Mixture calculator mockup.zip (84.4 KB)
Been working on this off and on for a while. Not a code writer, just have a visuals and a Hype Mockup (included). I will figure it out if someone can just point me in a direction. Tell me if this is even possible? Some sort of script?
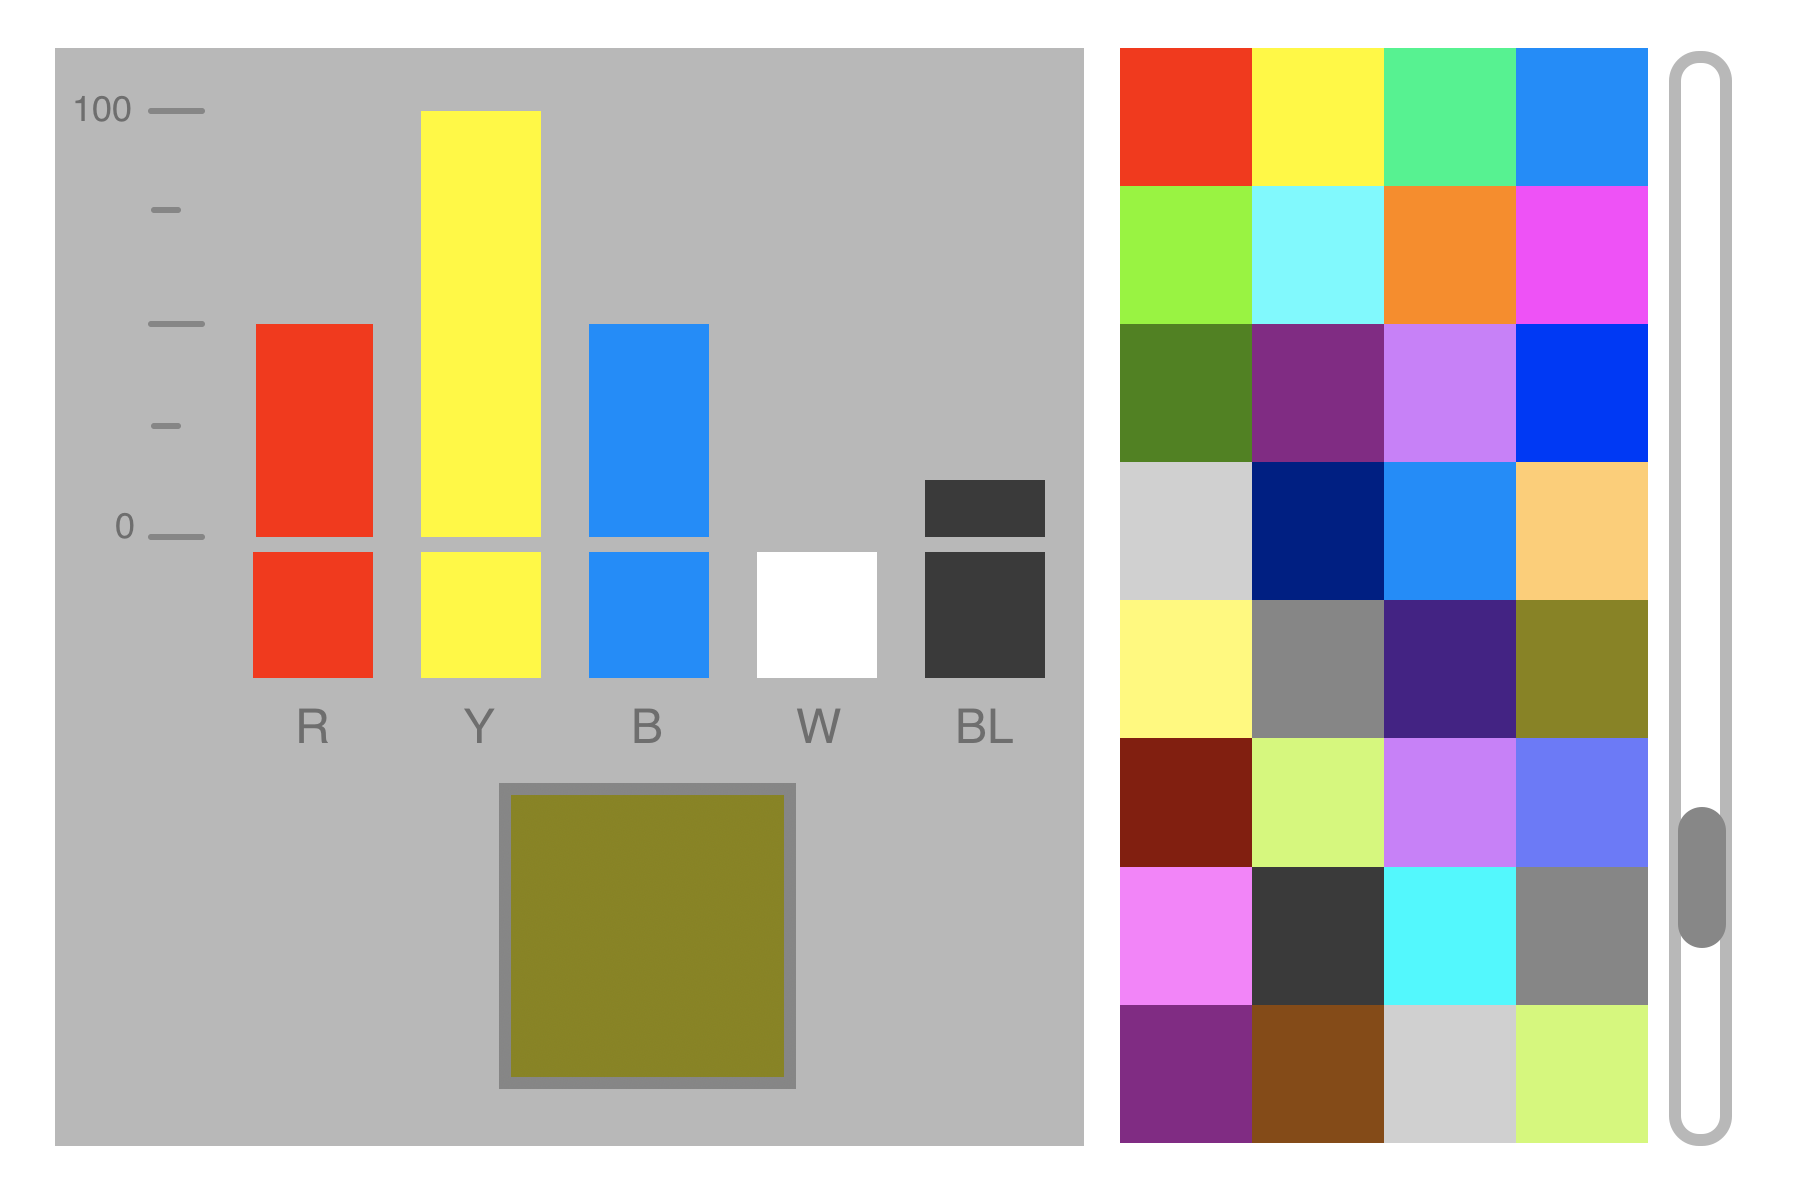
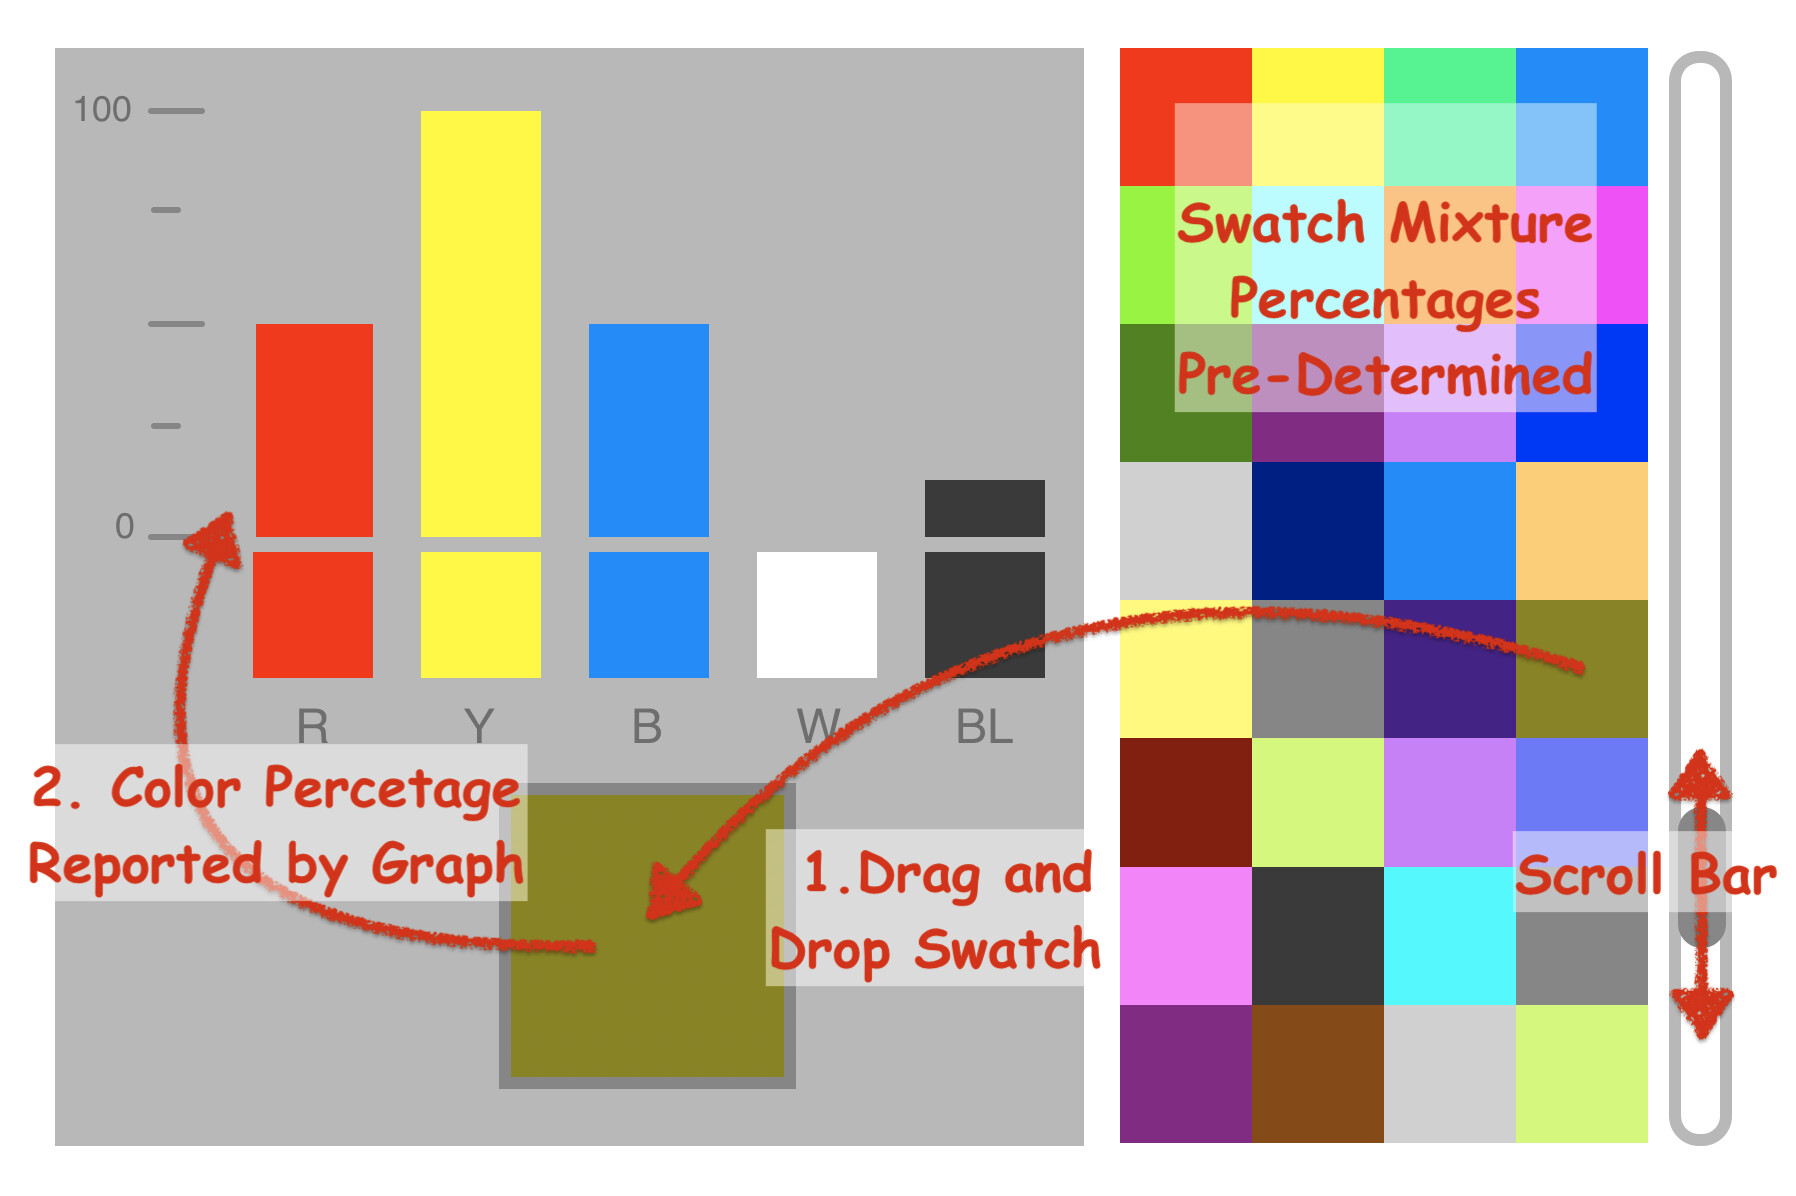
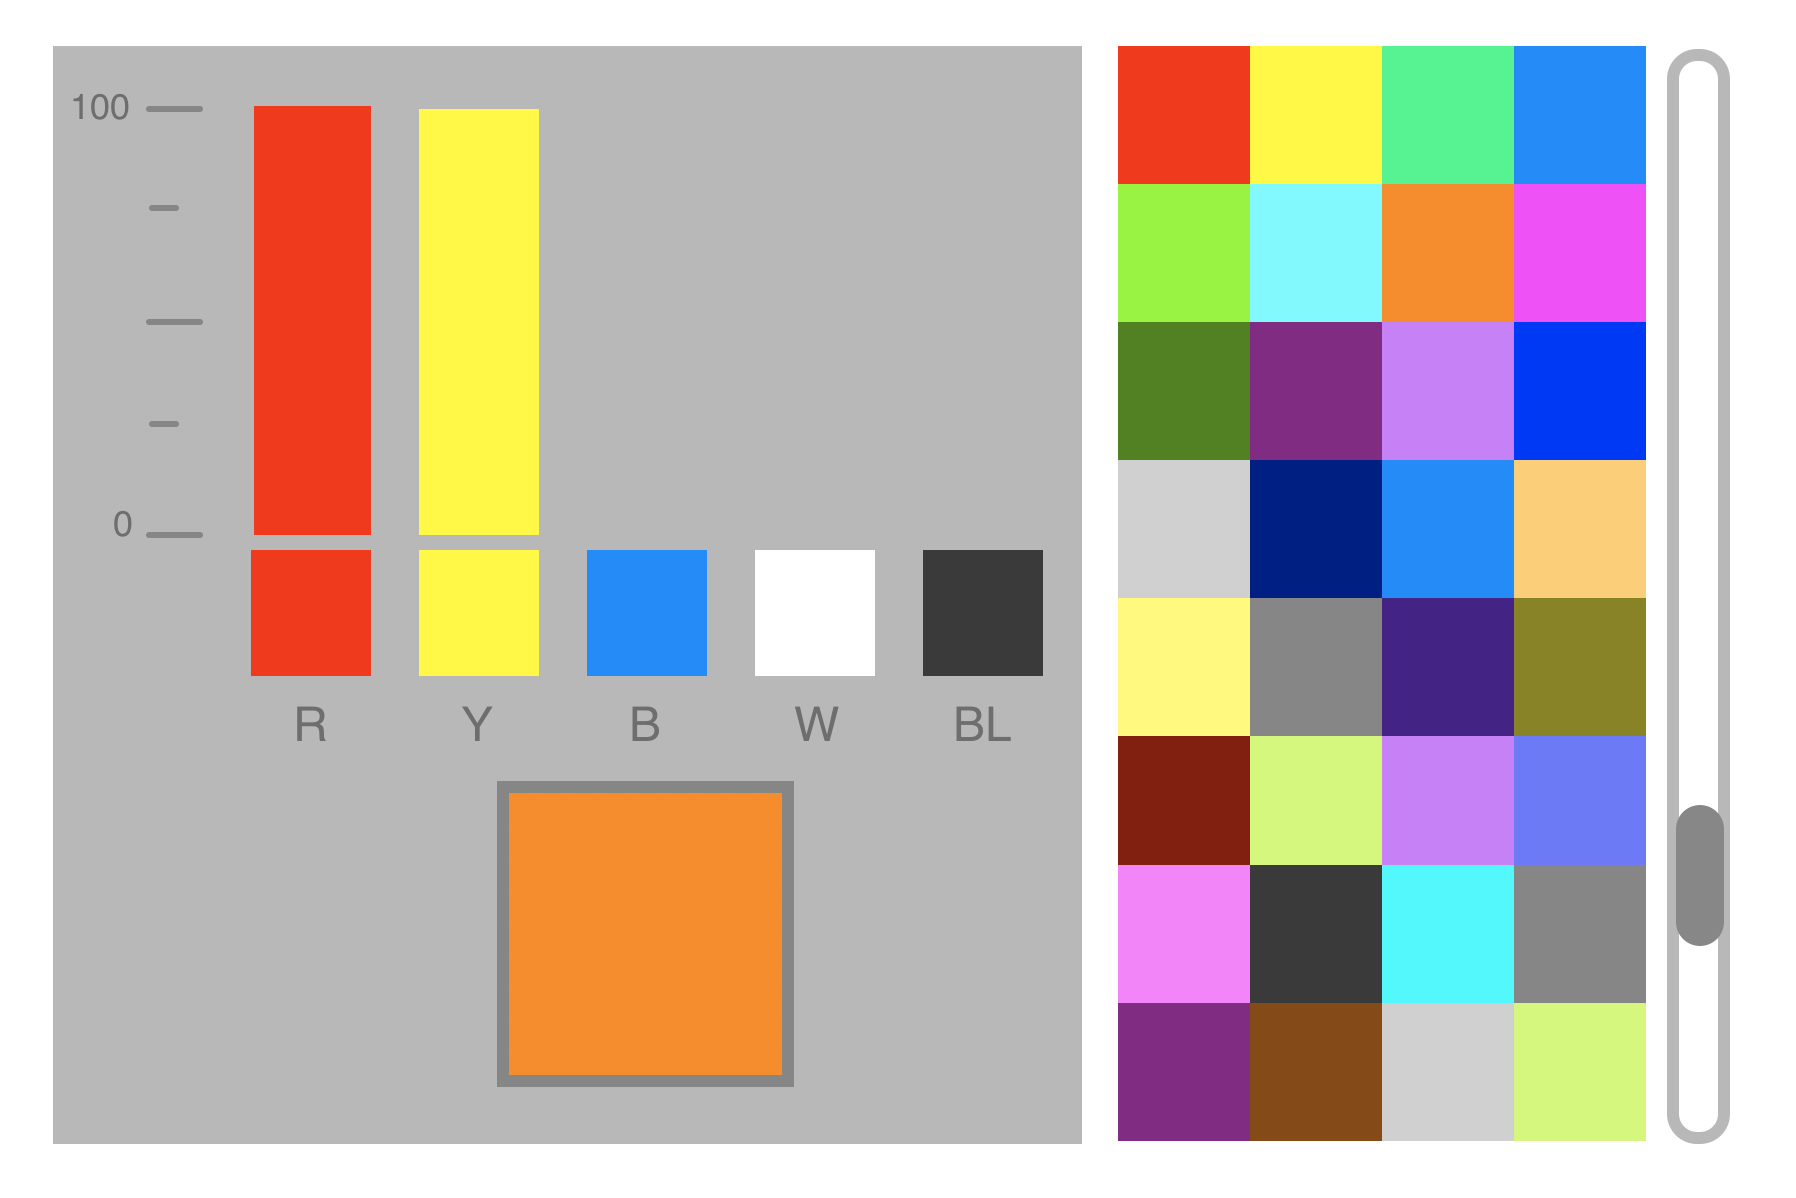
Want to embed this interactive on a web page. User drags swatch from pallet of predetermined values and drops it onto well (box). Well translates color predetermined percentage and animates graph to show mixture components. Don't want to have to create unique animations for 128 colors.
Mixture components are primary colors: Red,Yellow,Blue,White,Balck.
This is definitely possible, but will probably require some amount of glue code.
A lot may come down to if you favor having the data accuracy in RGB or in RYB. Starting with RYB means that you'll have fine tuned the values, and would need to convert to RGB for the computer. Starting in RGB means you can do a lot more upfront visually, but the RYB accuracy may not be what you intended. You can also supply both values for the project to fine tune paint and computer displays.
There's always multiple ways to tackle a problem, but if you favor RYB, I'd probably do something like:
Make animations for the R Y B W BL bars that go from 0 to 100, each on separate timelines
Use the Additional HTML Attributes in the Identity Inspector to either hold the RYB color values, or hold an index to a javascript object which has the values
On Scene Load, generate the color for each swatch by setting the CSS background-image for each element with color data
Either use a group with overflow scrolling and style your own scrollbar via CSS for the scrolling, or entirely use Hype elements and have the scrollbar perform an on drag to control timeline that animates the swatches to look like a scroll
On drop run some code that will change the dropzone to the specified color, and then also uses the Hype API to animate the R Y B W BL timelines to some value that maps a % to a time in seconds
I would see the biggest hurdles being:
RYB to RGB color conversion. Since computers use RGB you'll need to find some code to convert the color spaces. (I'd also ask yourself why you actually want RYB and/or why not use CMYK which will yield better paint results?)
Scrollable area that has drag and drop outside of the group, so your drag/drop may be dependent on that setup
Swatch value entry if you want to do it manual could take a while
You say predetermined, That sounds to me that you already know all the percentages and just do not want to create 128 animations.
If each swatch uses the additional HTML attributes with one for its named colour and five more for each percent value.
Then the coding would be very simple.
You would just need to get those values on drop and animate using the setElementProperty() API for each bar accordingly
Thanks for your reply.
This is intended to be an interactive for art students...beginning painters. We use a primary palette of colors in the beginning. Red, yellow, blue, white and sometimes black. I'm only concerned with approximate, visual mixture guidelines. It offers them a rough guide to each quantity of paint required to arrive at an approximate color, hue.
The scroll is easy enough.
You just style the scroll bar with css.
And have the scrolling groups right side line up with the rounded rect on top of it so it looks like the scroll bars border.
I did come close to getting a drag to look like it went across the two groups. Chart and swatch.
But did not fully work as expected. Once scrolled the drag would be limited to a new scrollTop or something. More hassle than its worth to figure it out.
Personally think just clicking on a swatch should be the way to go anyway. So thats what this does.
Each swatch has HTML additional Attributes which are used.
Gonna be fun putting them in on all of them. I only did the first left four ( red - grey )
I think I may have some swatch code I wrote that worked of a json that populated swatches with attributes. not dug it out.
But thats the way I would go which would be easier to write out.
Use the swatch id/class name and have an array of json objects like.
Yes! Thats great! It'll take me a while to understand this, but I'm going to try and tweak everything for my own use if that's ok? I work full time so it's been slow going.