This is a quick adaption from the swatch project i built and the csv parsing I use now instead of jsonp
The csv is a Numbers.app sheet export and in the example is internal to the project but can be fetched from any where including a public google sheet.
in the init function you set the csv url path.
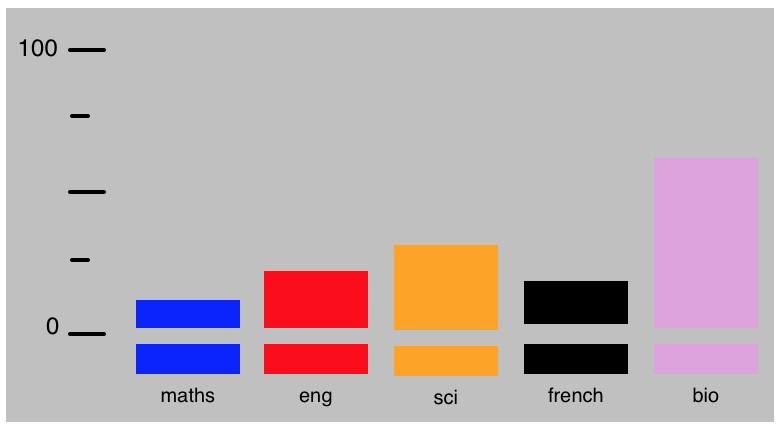
The run() is where you design your chart.
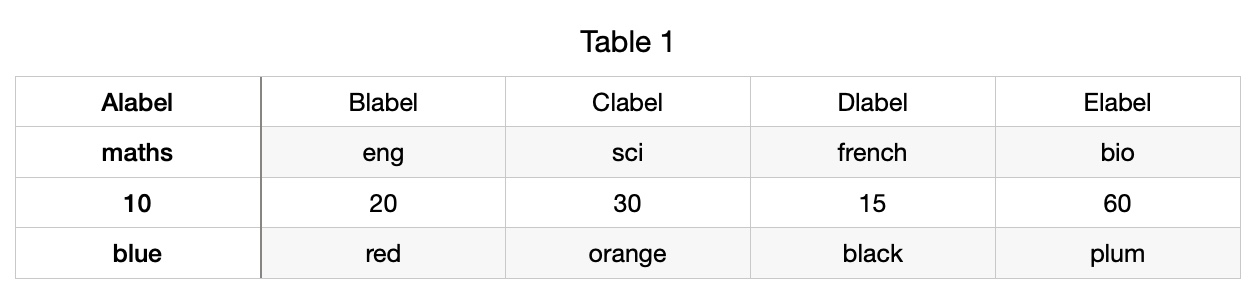
The csv rows ->
var labels = thisStuff[0]  //-- for bar text label Group ID  -- row 1
var textKeys = thisStuff[1] //-- for bar text label  -- row 2
var values_  = thisStuff[2] //-- for bar height   -- row 3
var barCol = thisStuff[3]  //-- for bar colour -- row 4
csvdata.zip (89.4 KB)