Hi, i‘m looking for a solution to animate simple bar charts with hype. Is it possible to import external datas for that (fe. csv) to keep them automaticaly uptodate? Any thoughts or examples? Thx!
Here's a basic example that involves importing data in a .txt file and loading it:
There are many examples of JSON, CSV and TXT importing for usage in Hype. In terms of generating charts, this would require reading that data, and then animating some property of a shape by feeding that data into a function:
A single line like this would set a 'bar' element in Hype to a new height over three seconds, if you set the variable 'NewPosition' to be the property read from a live CSV feed:
hypeDocument.setElementProperty(barchart, 'top', NewPosition, 3.0, 'easeout')
More properties you can set using this format are here: Tumult Hype Documentation
5 Likes
To add to Daniel, I also can recommend having a look at using CSS variables if that is something you can and want to explore. It is a very fascinating topic and drastically underexplored in this forum. CSS-Dynamische-Daten-Variabeln-Scope.hype.zip (38,3 KB)
Another approach is using fetch and JSON files and combining it with regular Hype function calls and Hype Data Magic: fetch_hype_data_magic_advanced.hype.zip (46,1 KB)
The basics of ingesting data using Hype are covered in the fetch command:
5 Likes
Another approach is to use JSONP… it is JSON wrapped in a JS file, as these have less cross-origin restriction. If this is something you have to consider, have a look at:
5 Likes
Thanks for your hints! Quite complicate for me  But i found a cool tool... https://flourish.studio/
Maybe also interesting
2 Likes
two more 
2 Likes
Yes, there are some good paid specialized SaaS out there… although they really take it from the living once you need it white labeled I must say!
just posted those in addition to the flourish one ...
This is a quick adaption from the swatch project i built and the csv parsing I use now instead of jsonp
The csv is a Numbers.app sheet export and in the example is internal to the project but can be fetched from any where including a public google sheet.
in the init function you set the csv url path.
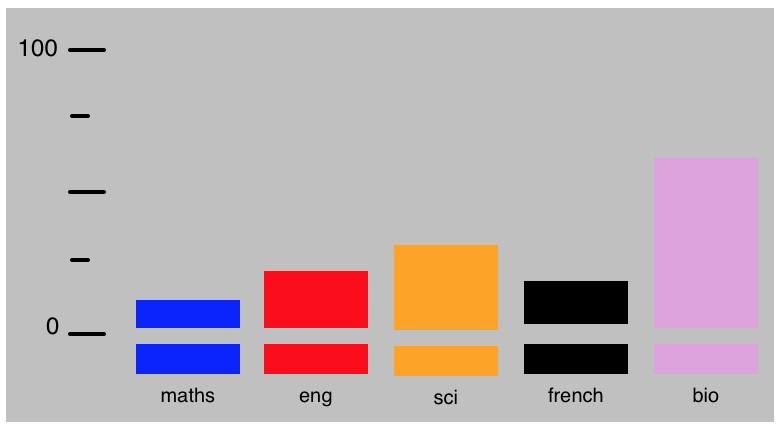
The run() is where you design your chart.
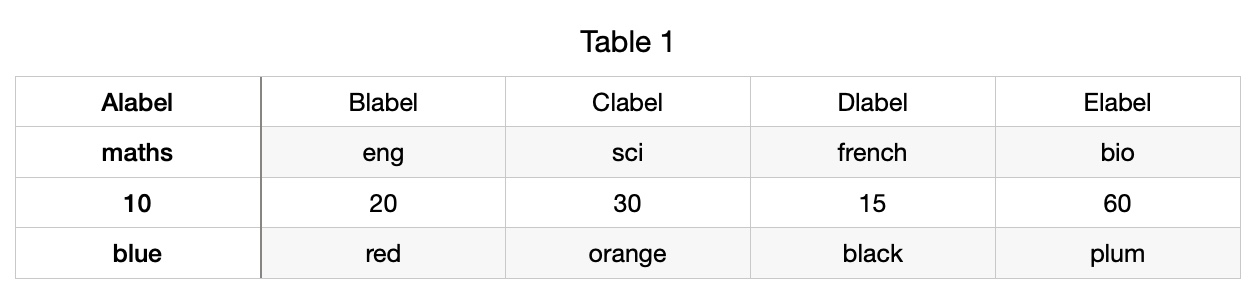
The csv rows ->
var labels = thisStuff[0]  //-- for bar text label Group ID  -- row 1
var textKeys = thisStuff[1] //-- for bar text label  -- row 2
var values_  = thisStuff[2] //-- for bar height   -- row 3
var barCol = thisStuff[3]  //-- for bar colour -- row 4
csvdata.zip (89.4 KB)
3 Likes
Same example but bars are now symbols, which means adding new bars is as easy as copying placing the symbol ,giving the bar a class name (i.e ABar,BBar etc.) and updating the csv.
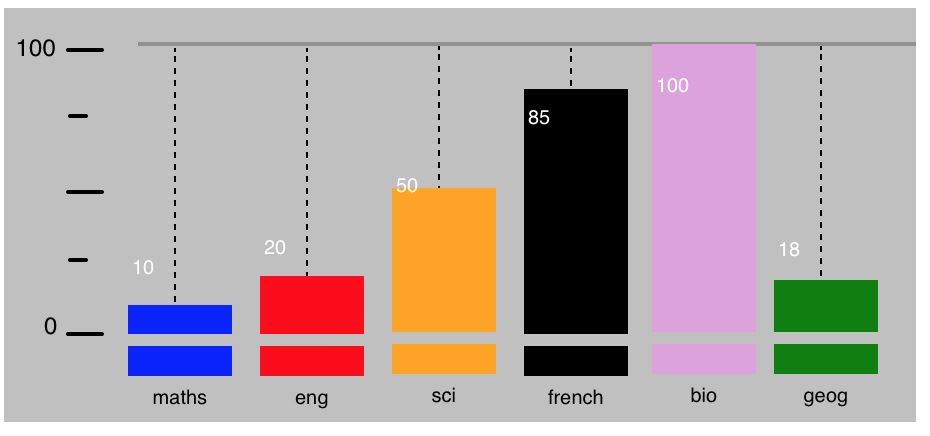
csvtest.hypetemplate.zip (38.2 KB)
1 Like