Hey all, back again with more questions. 
I have this header
http://takepart-infographics.s3.amazonaws.com/design-innovation/header.html
That rotates the gears on hover. It slowly starts eating CPU and I’m wondering why? The timelines are pretty long, but they aren’t doing much.
I did a profile and it looks like a bunch of objects are being created over time, but I cant seem to narrow down what is being created and why.
Any ideas?
Hi Lucas!
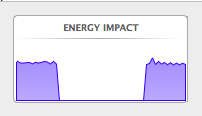
I’m running an iMac w/Safari 7.0.6. I am not seeing what you’re seeing. Using the Activity Monitor examining both CPU & Energy which I let run for 3 or so minutes (all gears turning). It was more peaks & troughs with not a lot of variance between them. Please see the screen capture below. The blank spot is I left your page & then came back after a while. The CPU graph (not shown) & the Energy Graph are twins basically in terms of profile variance.
I’m seeing this mostly on chrome. I’ll try safari.
