Hi everyone
Shown is a new interactive interface built with Hype and Chart.js. I used Chart.js in a HTML widget.
Some fairly complex (for me!) javascript to calculate the latitude/longitude values, also I needed to show the chart at several different latitudes so the best solution was to have several Hype scenes and transition instantly. Also Hype was ideal for drop down Modal windows.
Very nice! To clarify, is this meant to help do measurements of valles marineris via un-distorting the underlying image data? (I'd be curious if there's a bit more of a layman explanation for this? )
Would you be willing to share a zip of your .hype document? No worries if not, but I'm sure some folks would be interested in how you did the integration and which parts are Hype constructs vs chart.js constructs.
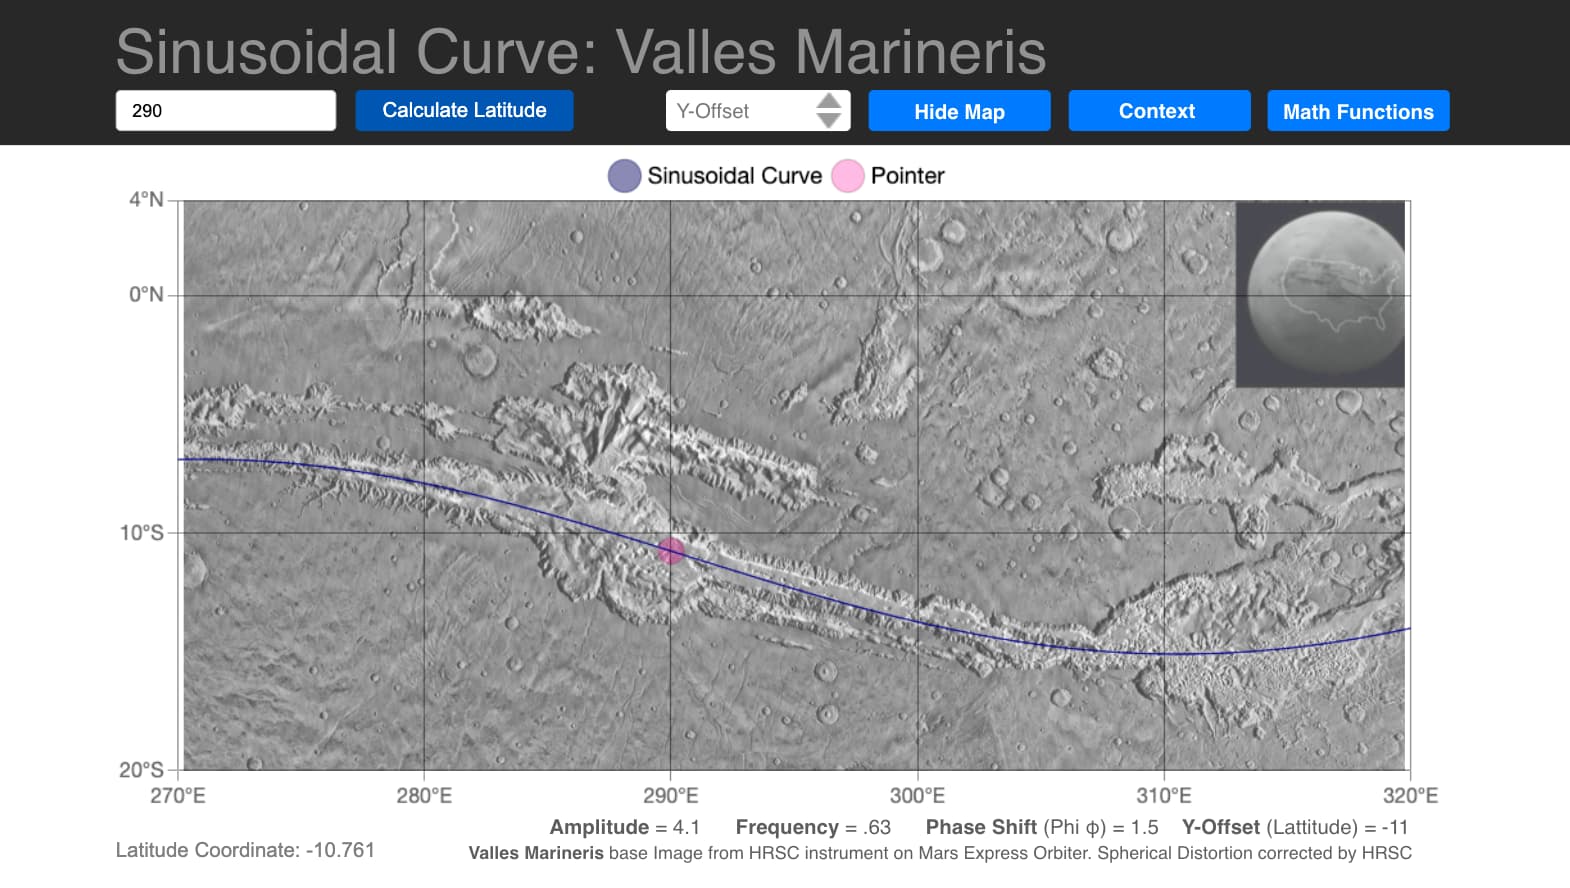
The underlying or base map is an HRSC image (from the Mars Express Orbiter)....the HRSC team went to great lengths to make sure there are no spherical distortions..so the base map is perfectly flattened to the flat plane..( see my Context Modal)
I wanted to prove that a mathematically derived sinusoidal function perfectly describes the Canyon system.. I think that this interface does this and almost makes it self evident
I would point out that almost no one in the Planetary Science community, especially those studying Mars, thinks that this sinusoidal curve exists or describes the Canyons. But there you are!
Yes of course I will send the original Hype file to show how the widget was built.
Many thanks for your interest and your original help when I was trying to get a preview of the chart to show in Hype - your suggestion was exactly right