https://forums.tumult.com/t/re-use-functions/13571
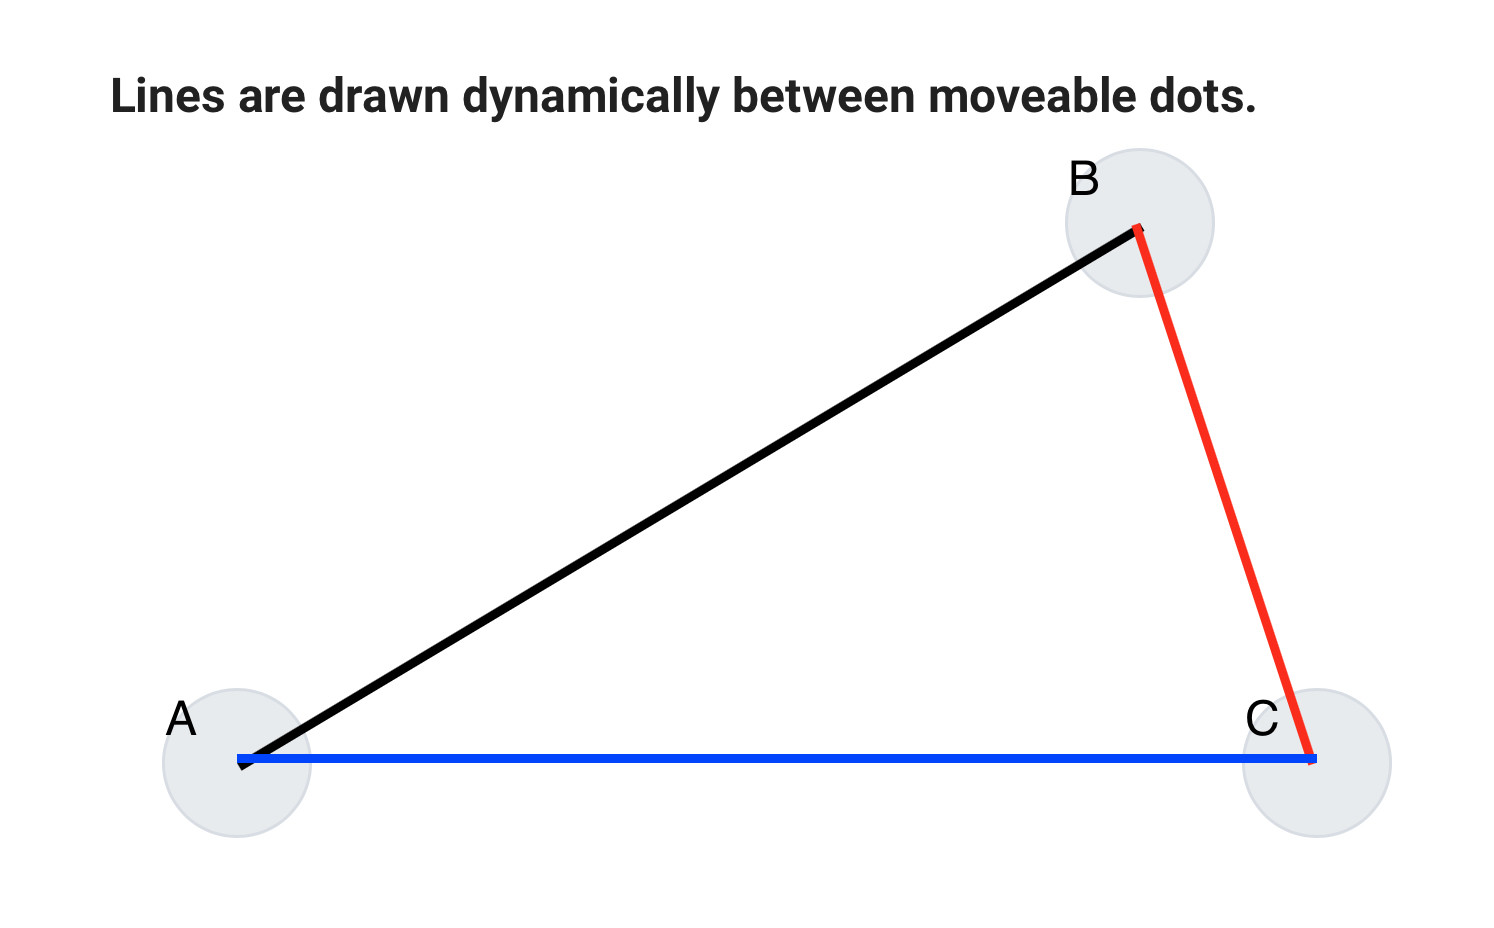
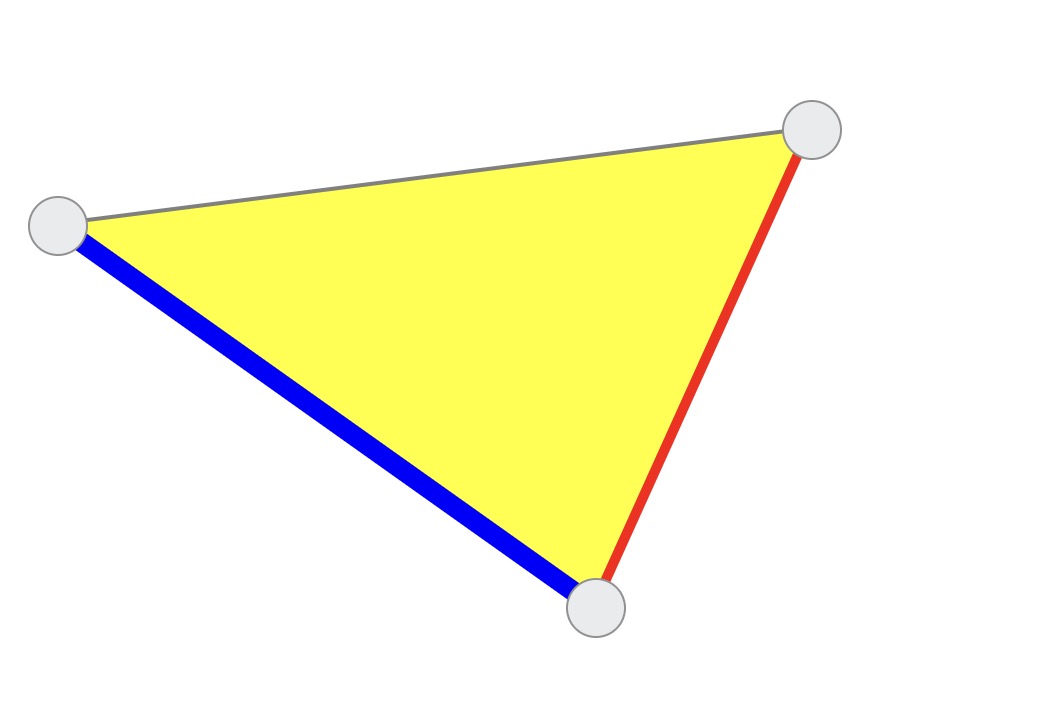
Using this article as a reference,I made a scene that displays a triangle using "lines drawn between movable points". This is used as a material for elementary school mathematics learning.
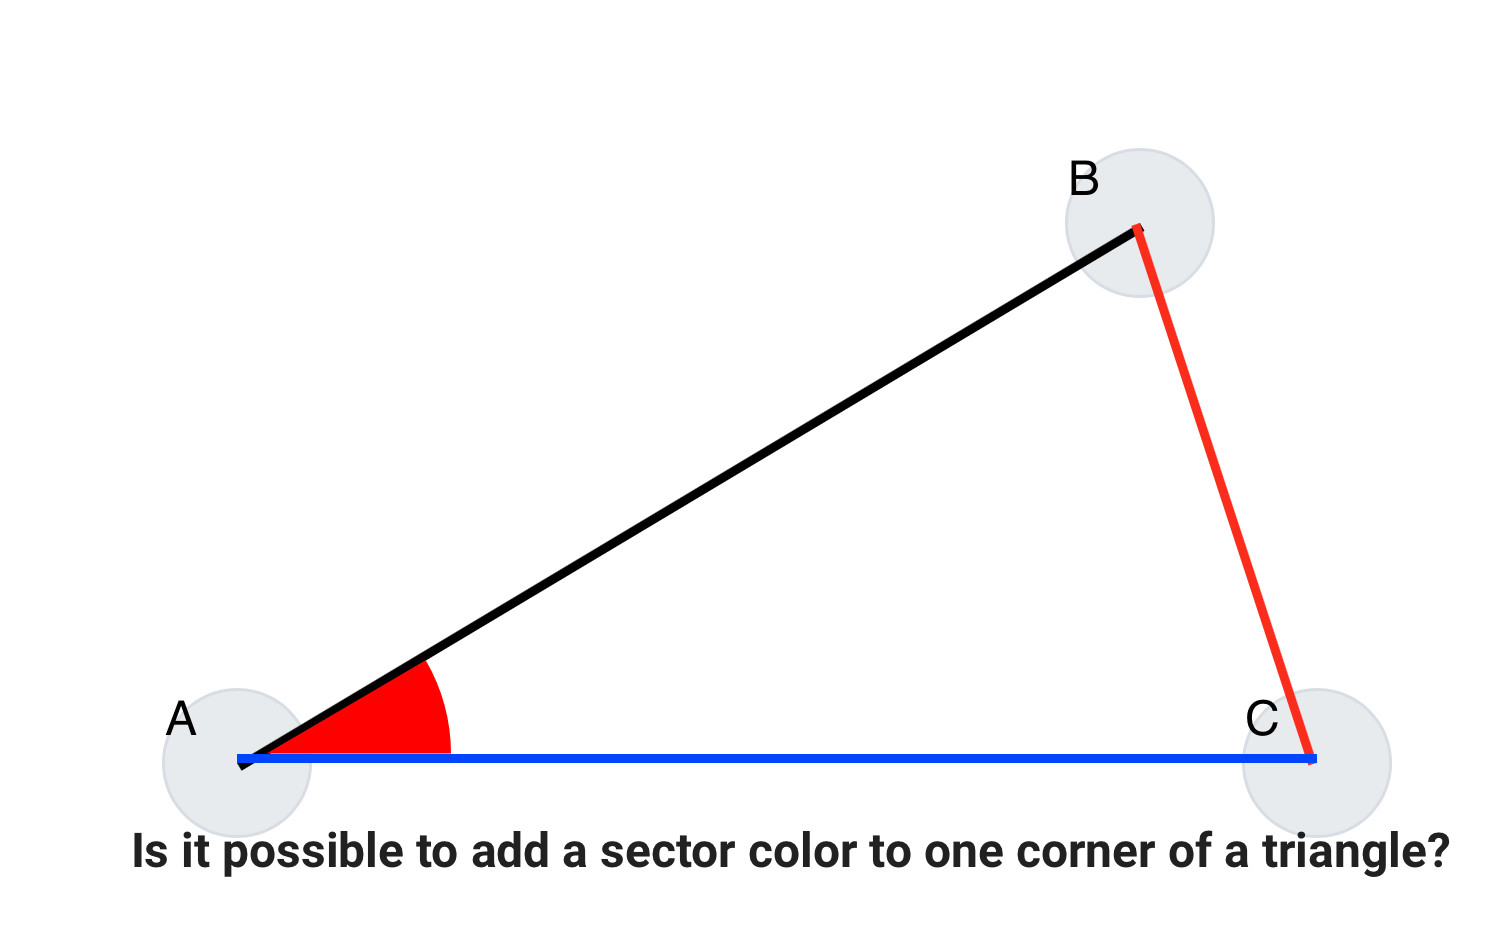
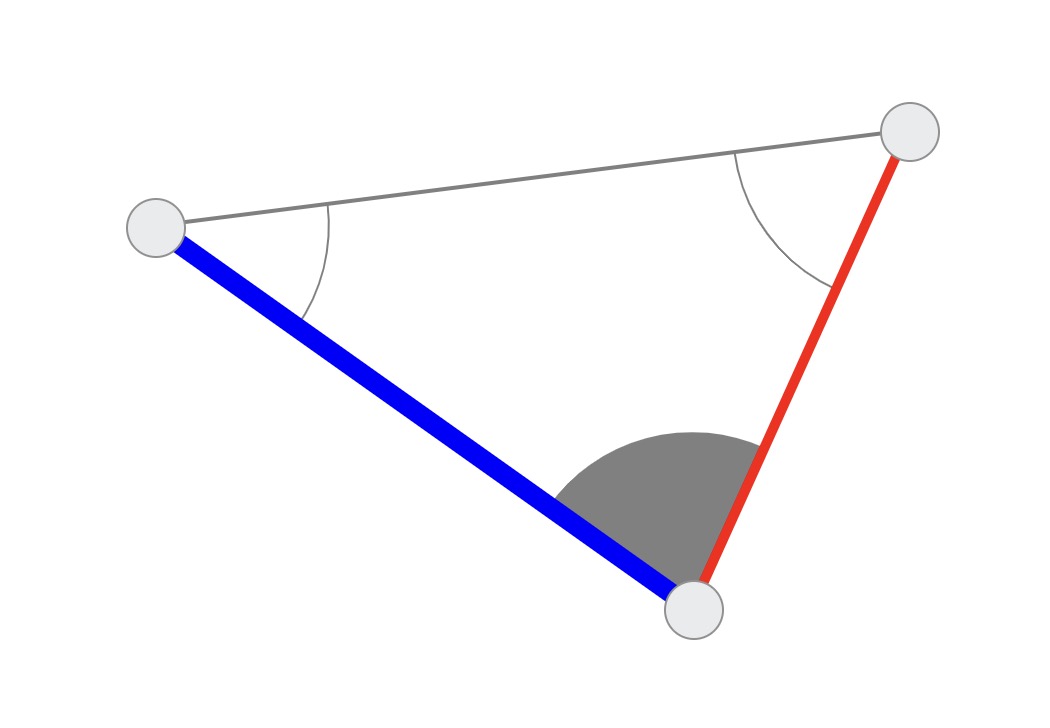
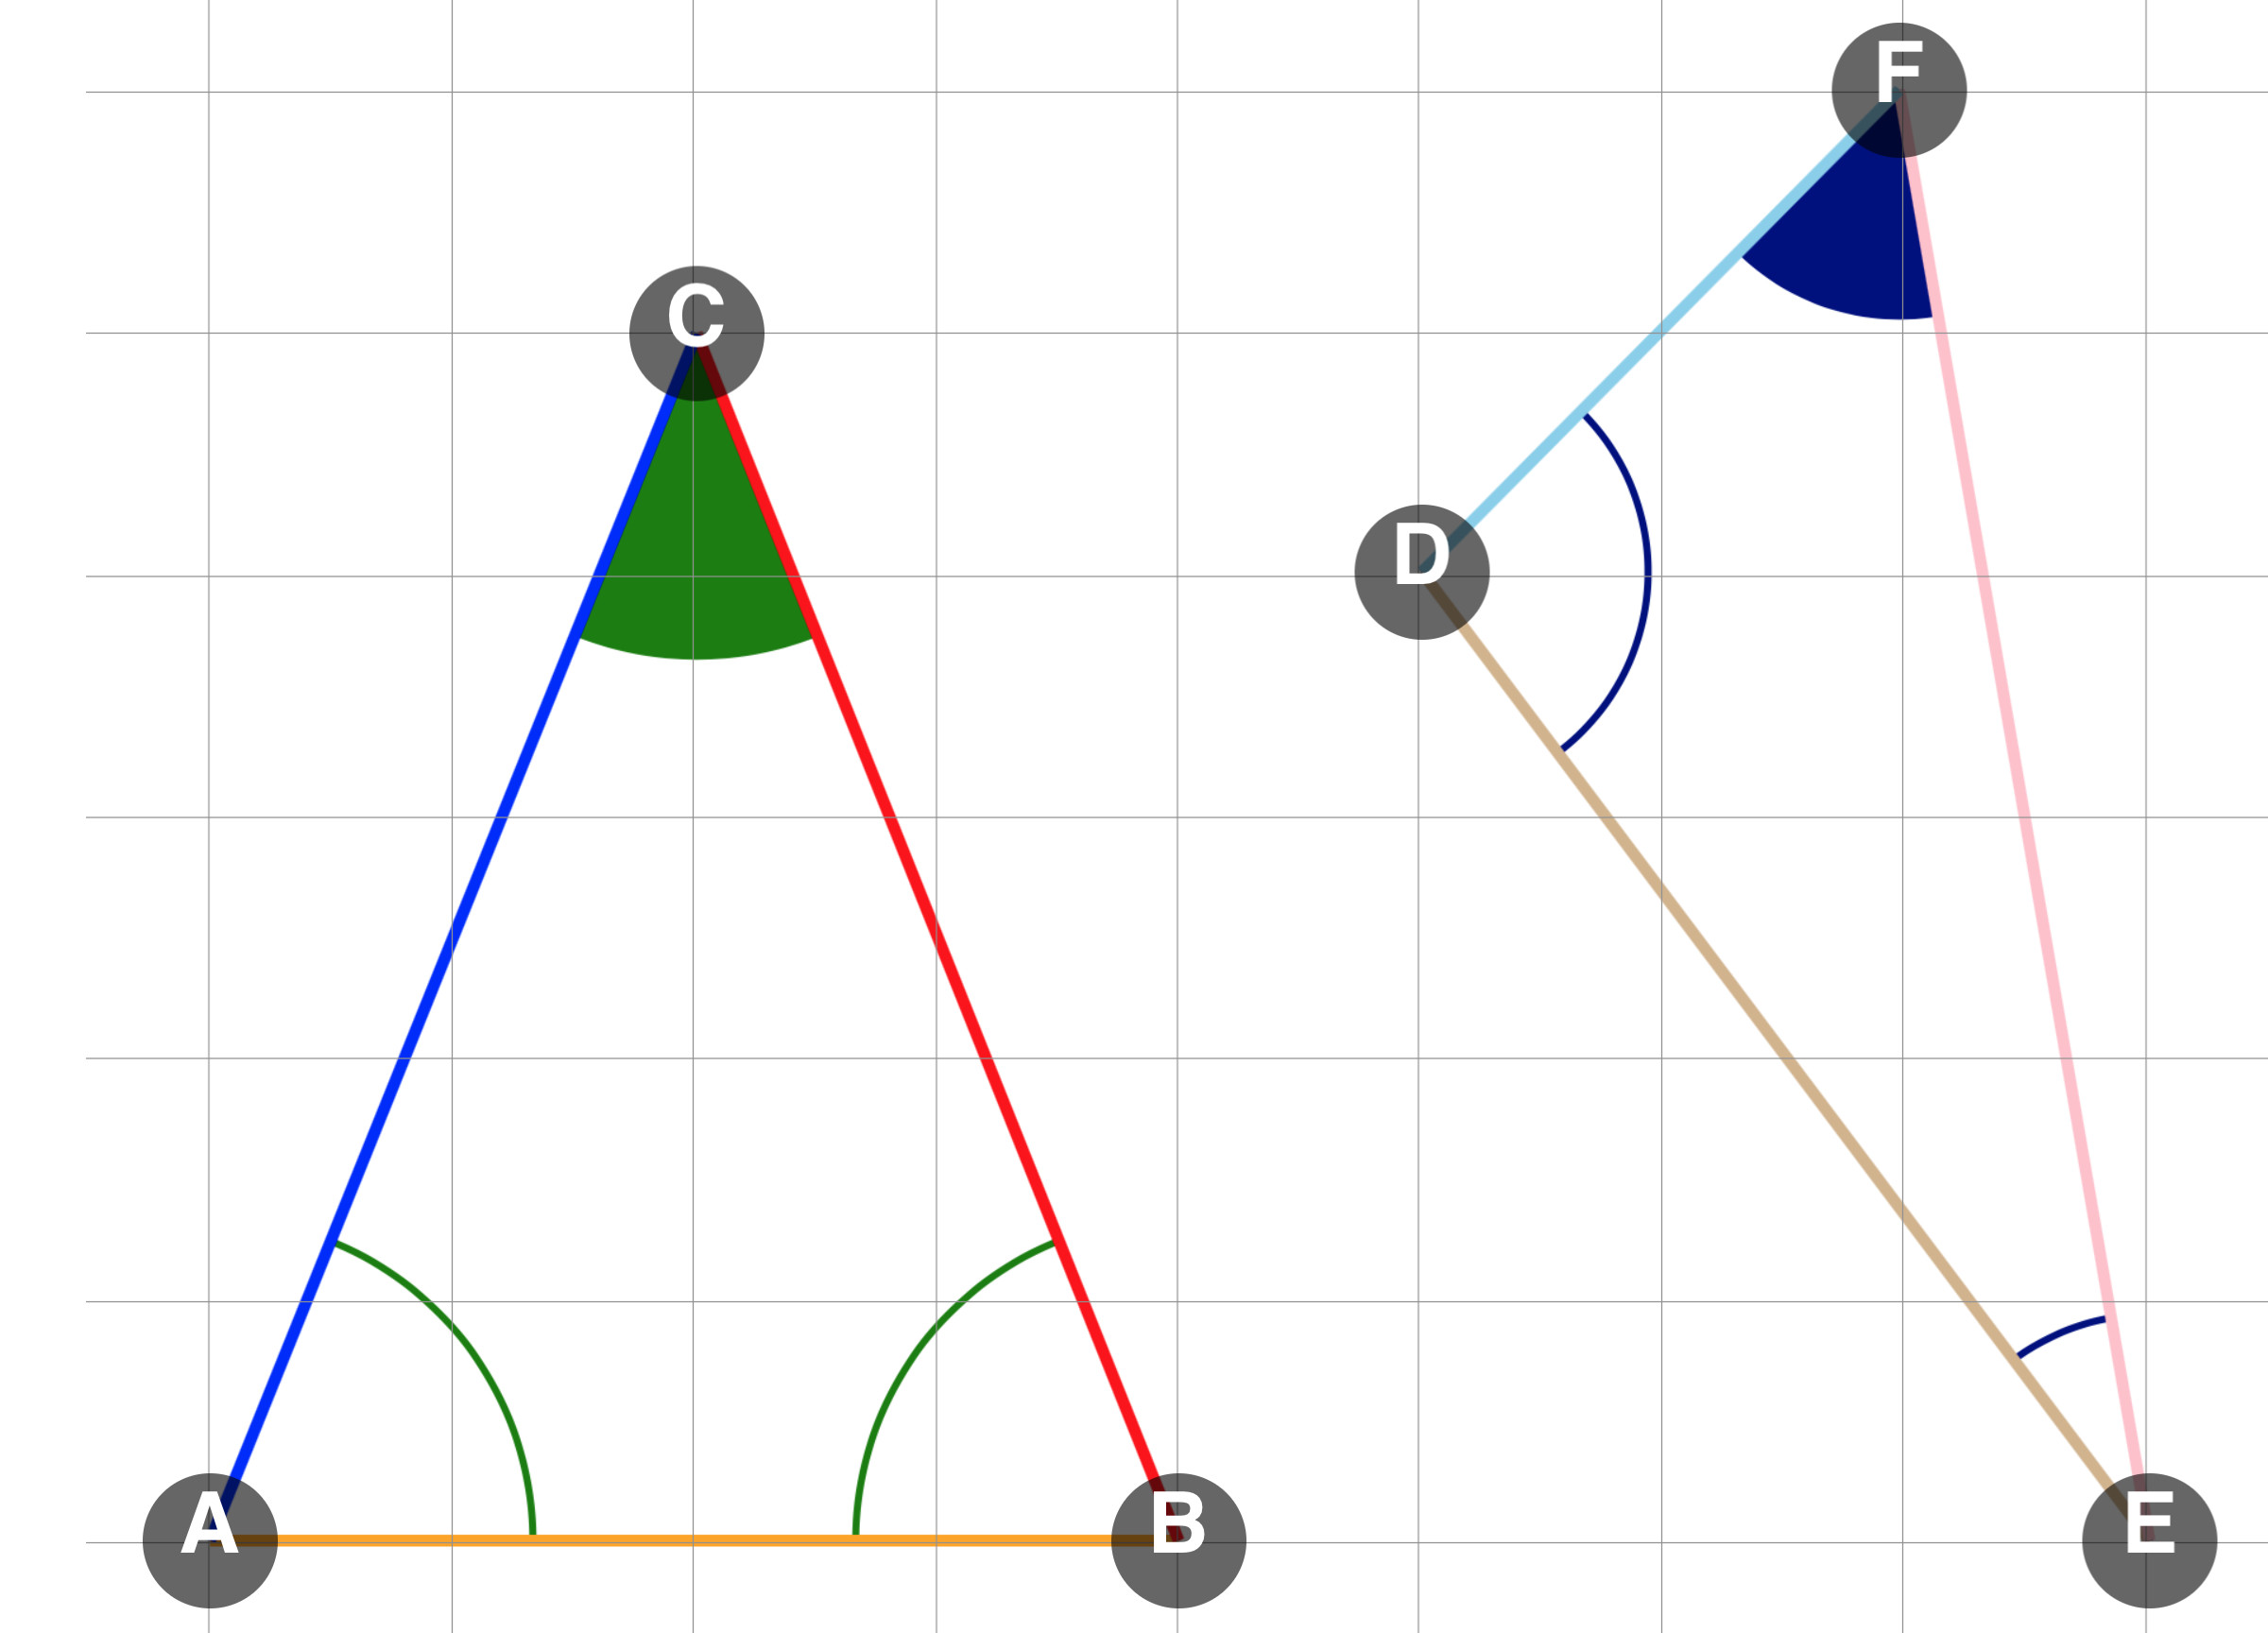
As another request, is it possible to display a colored sector at one of the angles in a triangle?
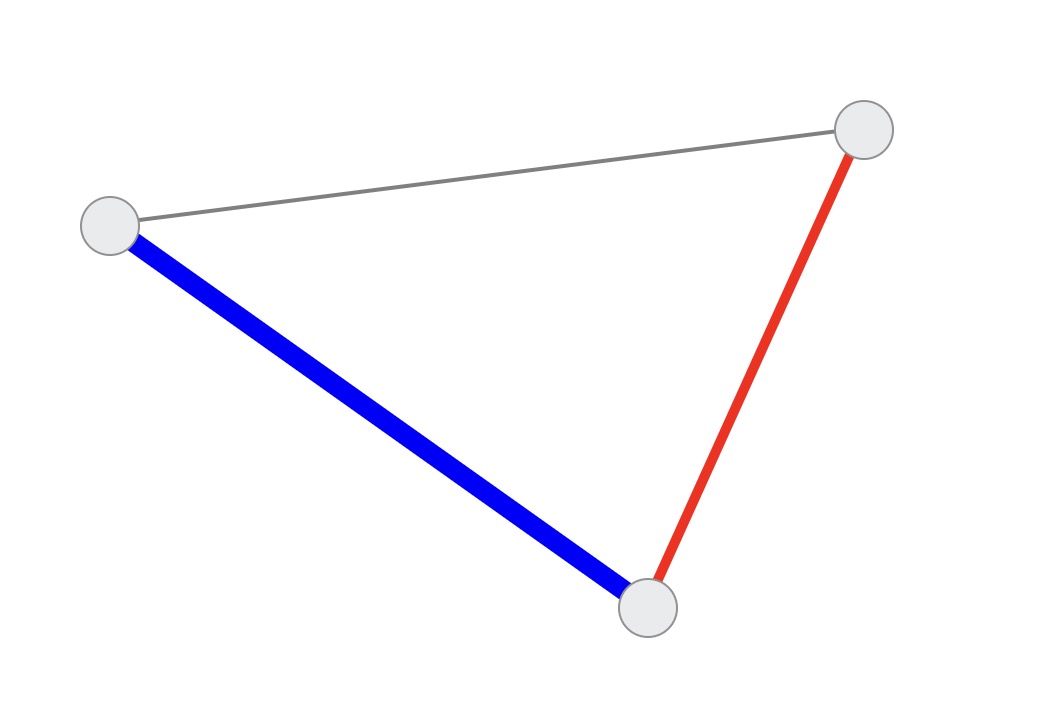
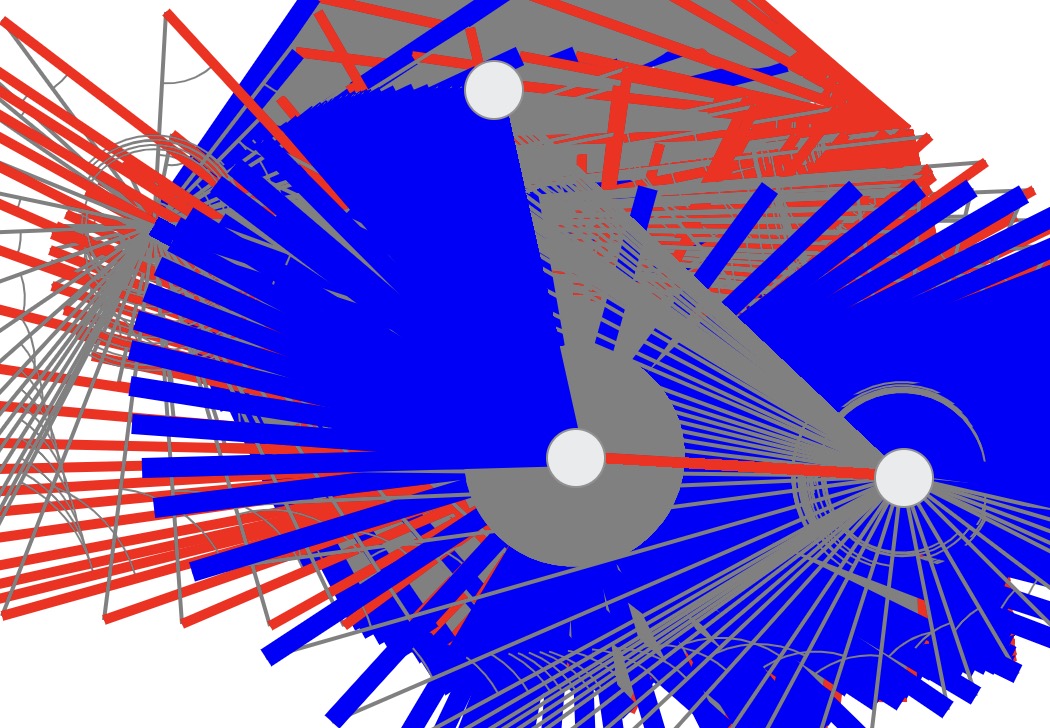
In either case, when the dots move freely, will the colored parts be redrawn accordingly?
I'm not a javascript professional, so I can't come up with any ideas.
Please suggest for good teaching materials.
...basically, you could create three Hype elements, like the gray circles in your example, that could be moved around with an "on drag" event. Then JavaScript / SVG could be used to draw the lines — based on the center-points of those circles.
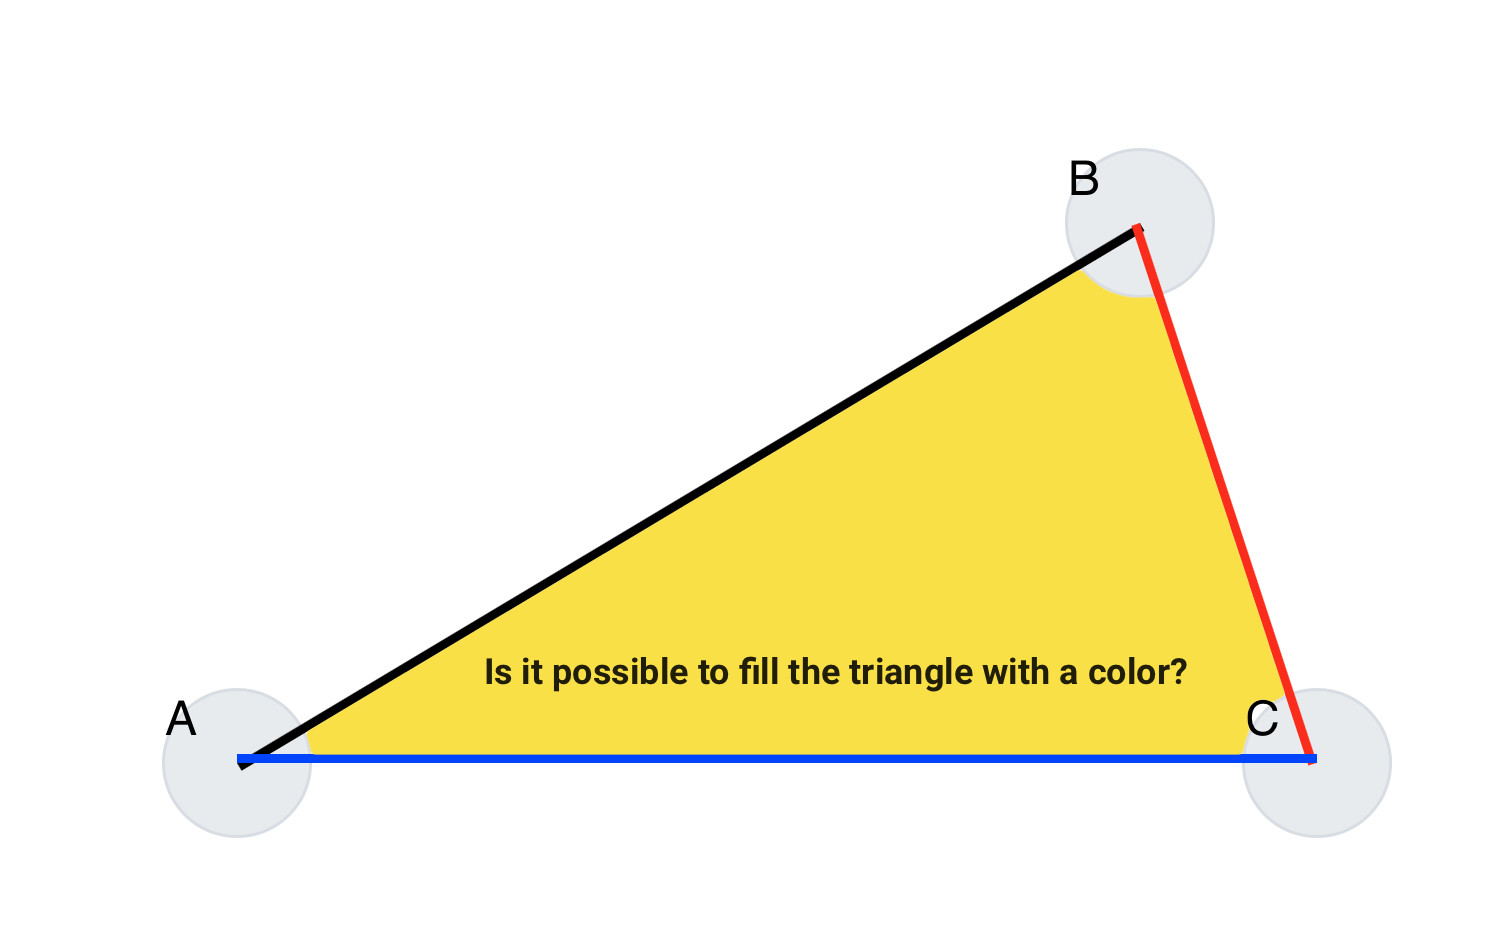
It's essentially a triangle, which is a polygon, so that shape could be filled with a background color. Highlighting the angle, whew, that would be tricky.
Has the benefit that anybody interested in Vector Math should be able to draw additional lines and gimmicks into the canvas based on a cartesian coordinate system using pixels.
Canvas is a bit more involved than SVG but fun because it's hands on. @h_classen is right with the SVG approach as it leverages a library and the vector nature of the format! In the case of SVG you need to set up nodes via JS or in an imported file and then manage them to move in sync. The upside redrawing is done by the browser when you manipulate the SVG structure. In case of canvas you don't have to worry about SVG structure as your basically just painting with "crayons" onto a whiteboard and in the next animation frame whipping it clean to start over again.