I want to explain about quadratic function such as “y = 4x**2 + 3” to junior high school students with hype animation. But it’s difficult for me to describe parabola line. Would you give some hints?What I want is kind of an animation that the line stretches from x=-20 to x=+20 for example
Personally, I'd probably just use SVG and JavaScript. The points on the line would be drawn with a loop. The closest match I have to that is the Pythagorean Theorem…
- Template — Free Template Tuesday #5 – Tumult Hype “Pythagorean” – Photics.com
- Video — [Hype #5] The “Pythagorean” Template (Building A Hypotenuse Calculator — A² + B² = C²) - YouTube
Basically, a line would be drawn with an array that is created with the JavaScript calculations. The FPS (Part II) template / video is an example of how to draw a chart with SVG, JavaScript, and an Array.
- Template — Free Template Tuesday #8 – Tumult Hype “FPS” (Part II) – Photics.com
- Video — [Hype #8] The “FPS2” Template — Using An Array To Make Dynamic SVG Images - YouTube
The downside to this approach, besides the math and coding part, is that the line would be straight. So, the line could have a lot of points. Instead of increments of 1, the steps could be o.1 or even 0.01. Alternatively, perhaps bezier curves could be calculated.
Alternatively, you could just draw the line in Hype. Then, just animated the line — it can be drawn in. The “Heart” video shows the drawing of a heart with a line tool…
So, if a heart can be drawn, perhaps Math charts can be drawn too.
1 Like
I would be using a Canvas object in innerHTML and a bit of simple JavaScript to draw the line into it. Have a look at these two threads:
and
1 Like
thank you for such helpful suggestions.I’ll work on them soon. But any of them looks so hard for me to understand that it seems to take much time. I’ll be here again, if something I wan to ask comes up. thank you very much, guys
Just use the macOS application Grapher then. It should be included in your application/tools folder, it’s free powerful and by Apple.
1 Like
I would not know how to work out a parabola function even if a brick hit me in the head using it.
![]()
But I just showed how to make a circle line drawing.
You could do a similar thing.
Since you will know what parabolas you want to show on each slide.
Just put a graph as the background.
Example:
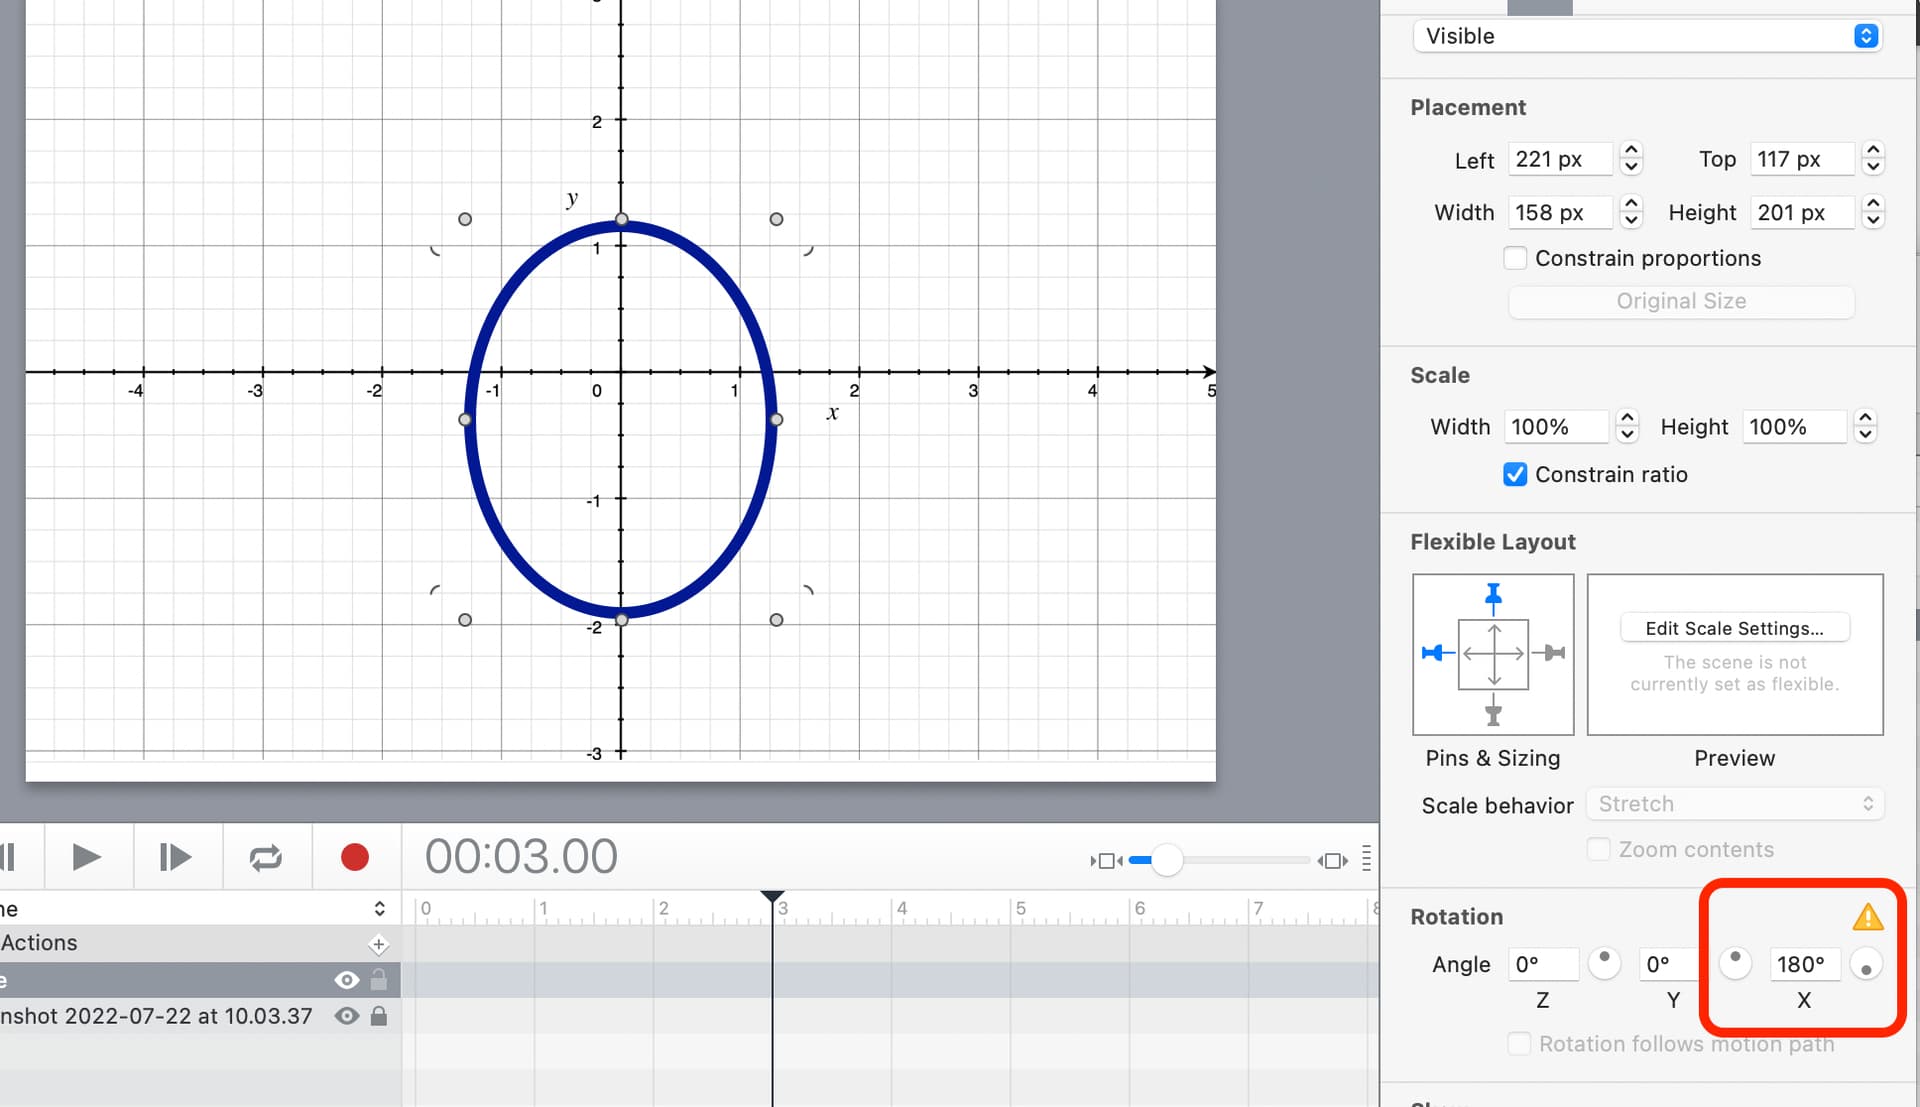
1, Put a Circle on top of the background.
2, Shape you circle to the so the top half meets the three points you want.
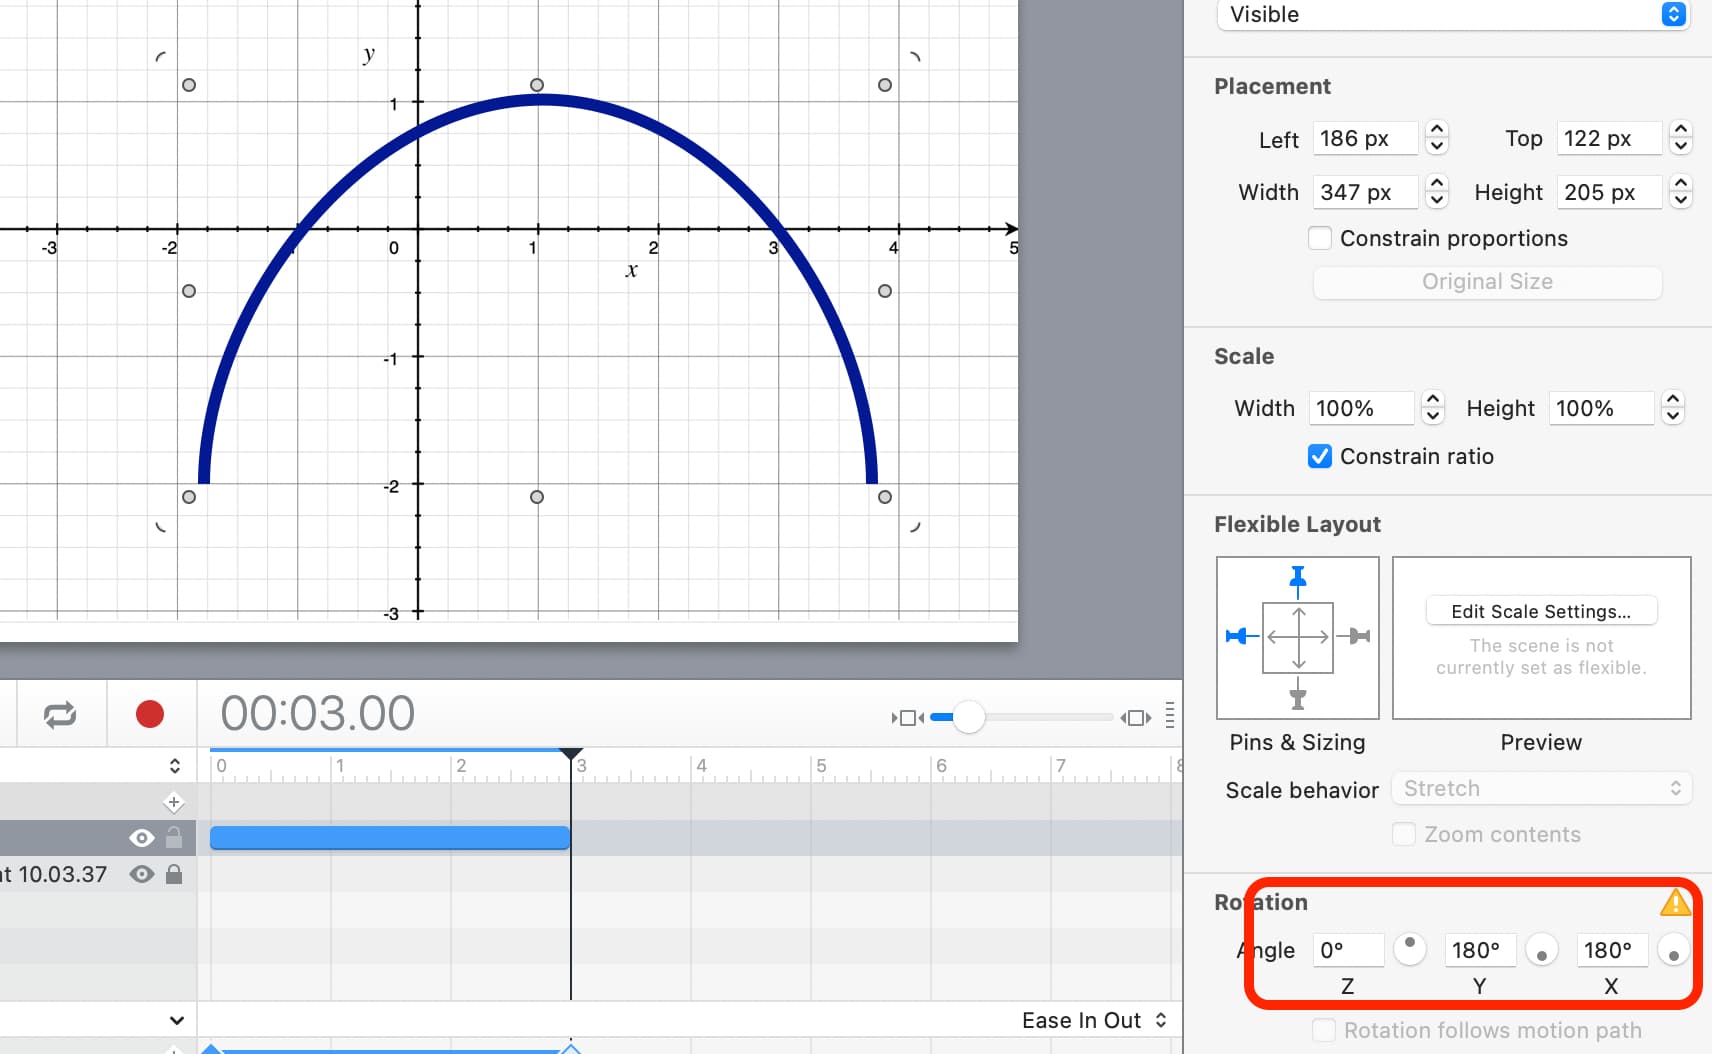
3, In the Metrics inspector,
set the x angle to 180
4, Covert the circle to a vector shape.
5, In the Vector Editor on the circle . Choose open path
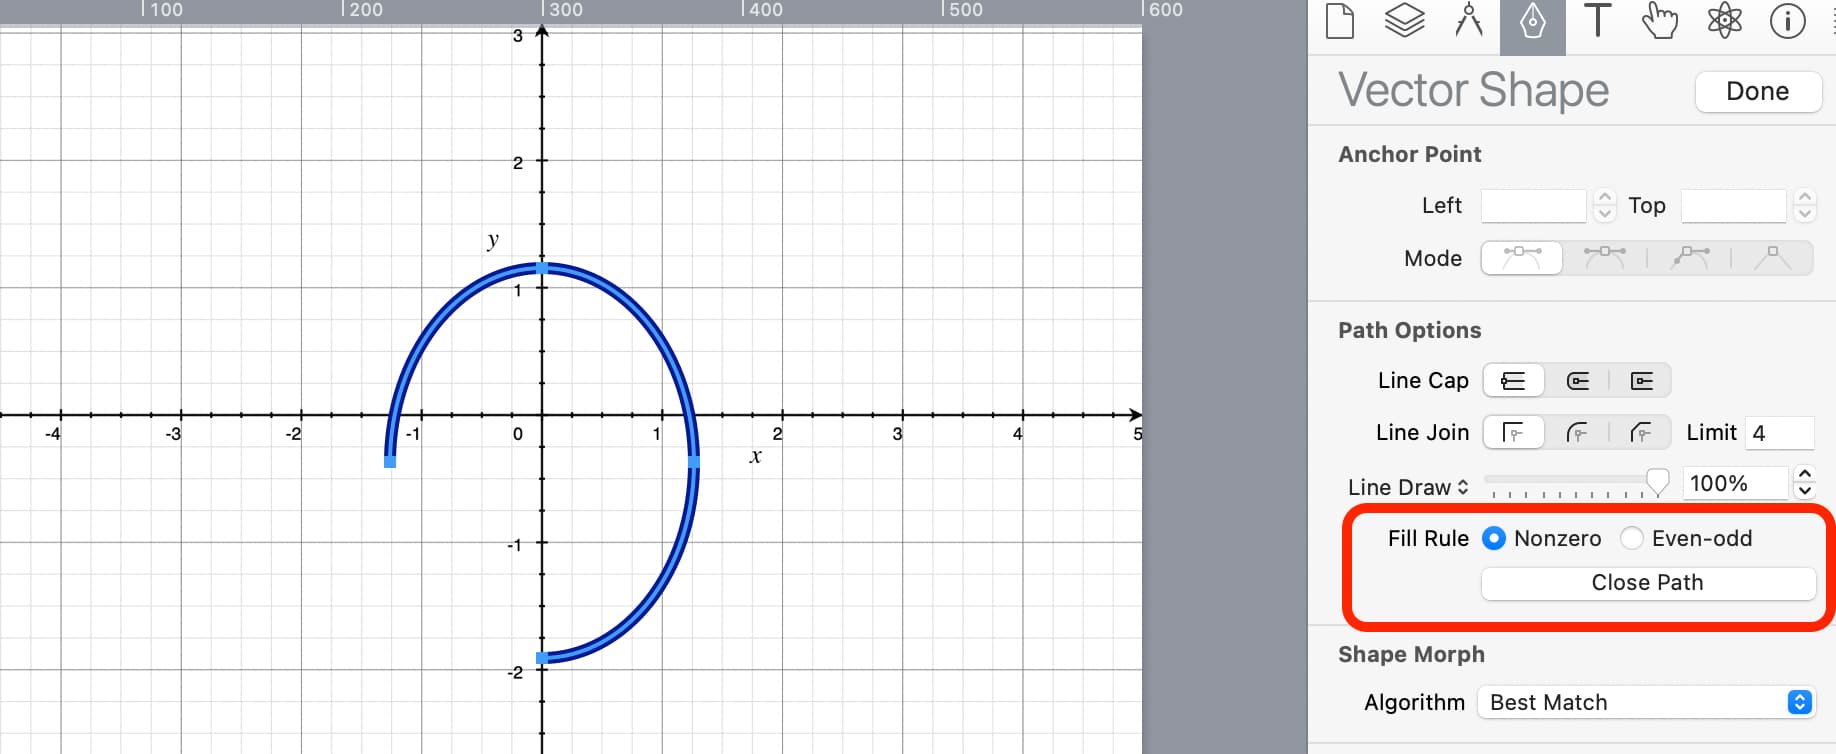
6, Select and remove the bottom point.
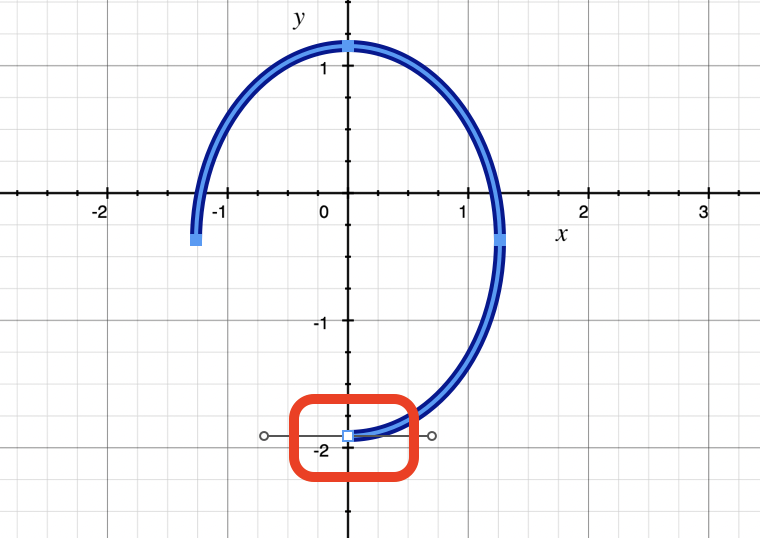
( you may need to Hit done and move the element back up into position again)
7, In Vector edit mode, set the line draw to 0 and as in the post I mention above,
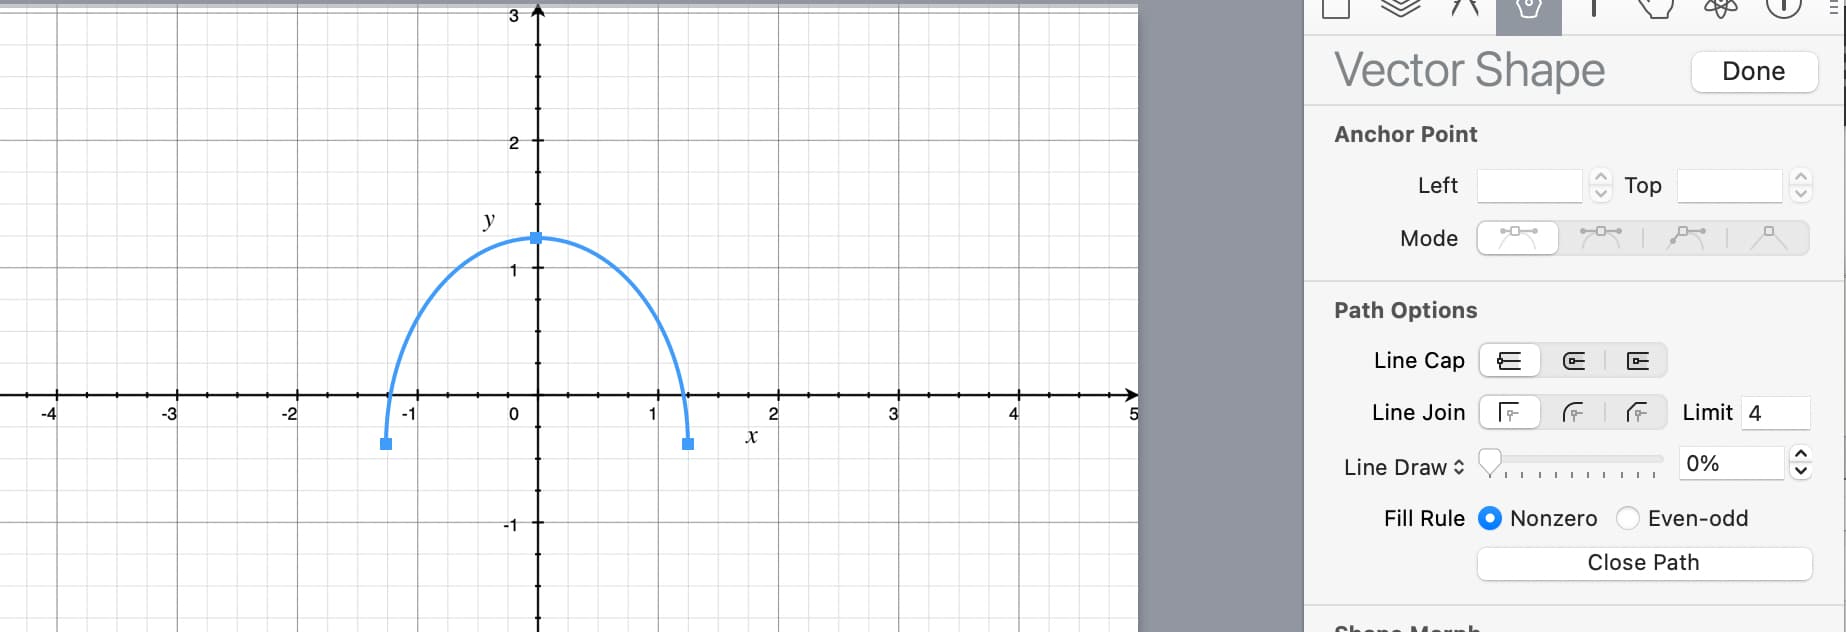
Hit the record button, set the keyframe to the duration you want, change the line draw to 100.
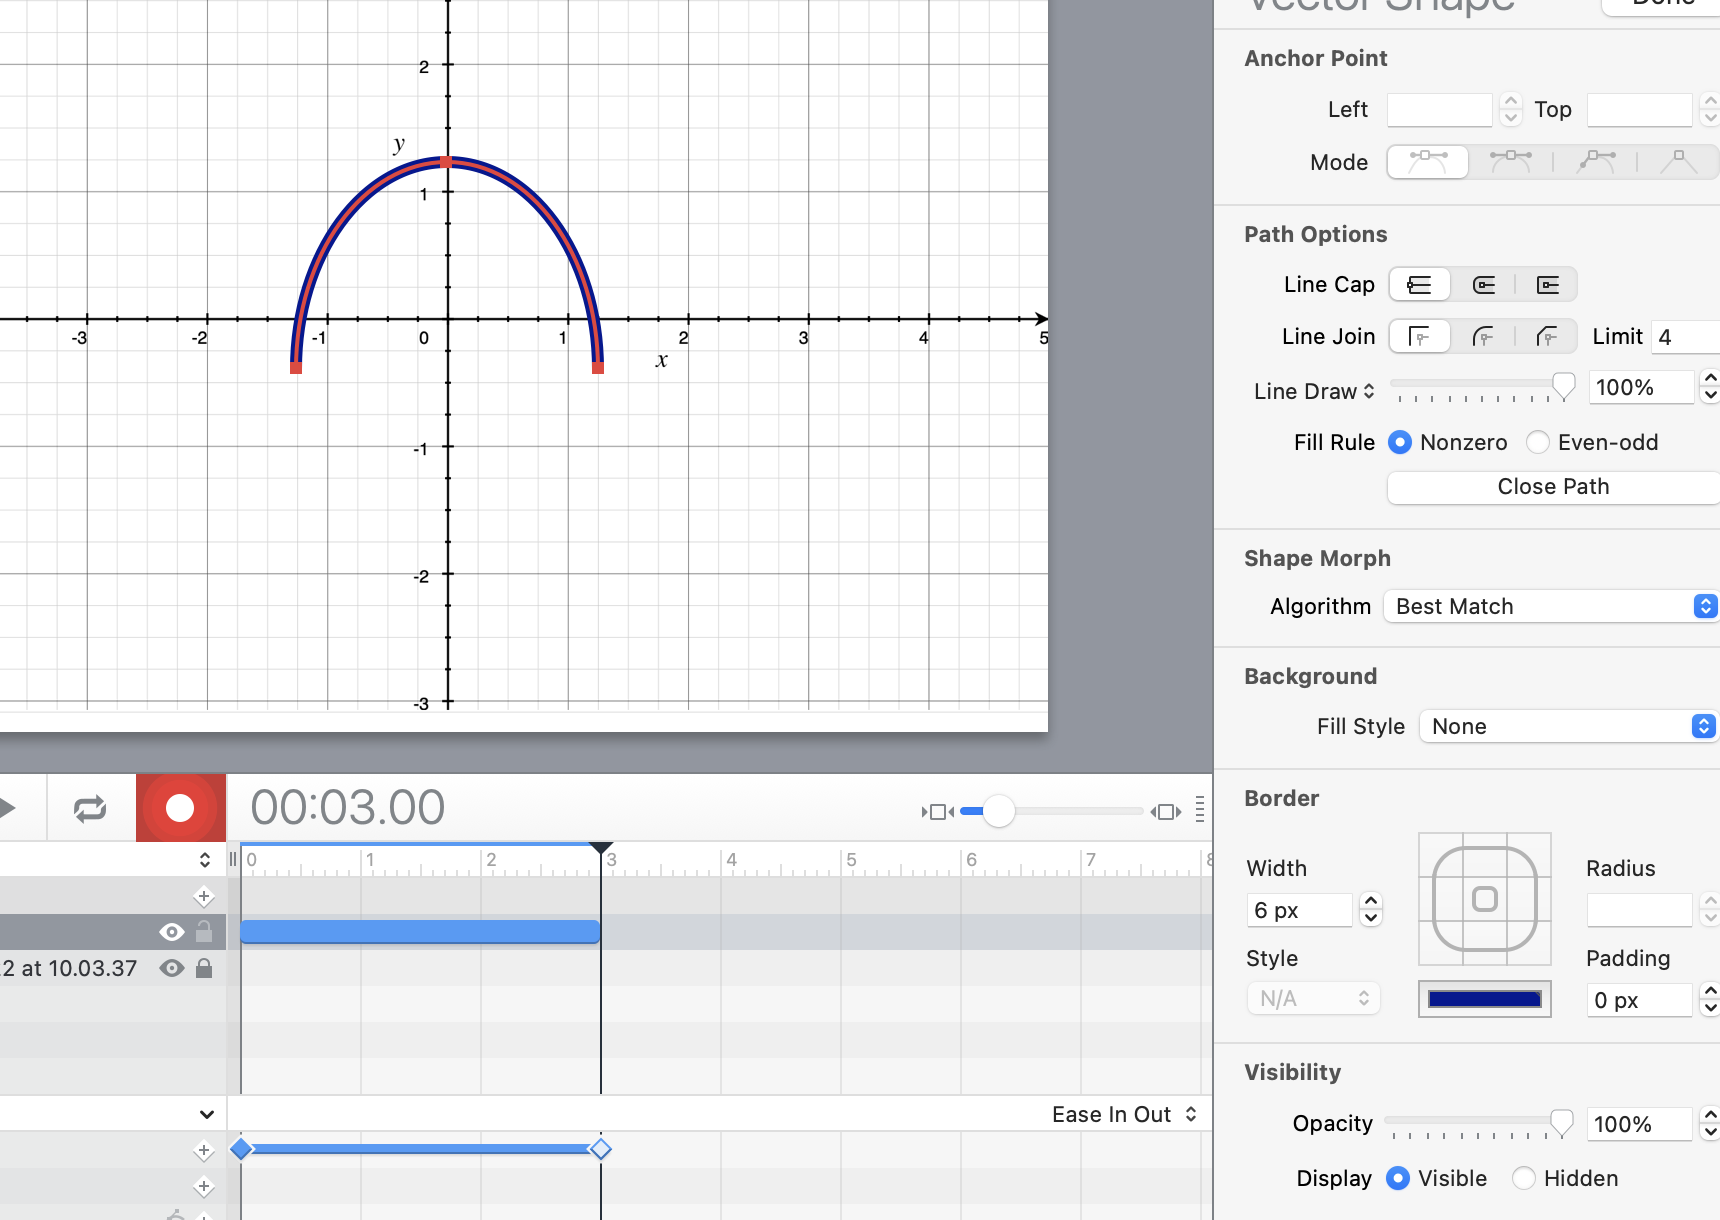
Hit done.
You can play with the rotation angles to get which ever directions you want..
Also you can re shape the element as needed using the drag handles ( not in vector edit mode)
Note because we change the angle, the element will flip about when you try and change the shape and size. Just keep going it will correct itself.
And you can also adjust the points in vector edit mode if needed.
You can make the animation stop and start where needed using the normal method of keyframe actions and mouse click actions.
And add other elements like text and element shapes.
3 Likes
Don’t undersell yourself @MarkHunte … it is rather trivial, but the means to draw arbitrary lines are not part of the Hype API. Using regular HTML5 and canvas you can draw lines really easily. What you need to do is increase the x variable as requested by the OG from -20 to +20 and the resulting y variable is dependent on the provided formula
The line is drawn from the last value of x,y to the current value of x,y. That’s all it is.
Grapher does a great job displaying such things. Doing it in Hype would require a little programming if it should be accurate. I am currently not on a computer. Using a line animation can be a good approximation to demonstrate certain features, though.
3 Likes
Ta,
I was probably taught it in school but in my real world never had to use it.
Seems to make sense to me.
1 Like
thank you for the tips.
Although it's not exactly parabola, it's very informative for me as I'm new to hype and didn't know how to handle lines of SVG .
By the way, I can see you have "Vector Shape" tab on your hype UI. Is that including in paid APP ? 'cause I'm now using free trial version. I' going to purchase Professional (Full) soon at any rate.
I'm pleased to know that this forum is so active, which I can get res soon.
Can you post an image of what is and what you want to show.
Yes it is in the Pro version & Standard , the standard has some limitations on them I think.
thanks. Woukd you take a look at this pic ?
It is not same formula as one in my original query.
But what I want is like such line.
Giving up animation, I want to draw such kind of static lines of any formulas at least.

Simple template here:
3 Likes
Thank you. I was like "Wao" when I downloaded this file and checked it.It's really great sample for me. 'cause what I need to learn first was extracted and the content was concise.
2 Likes
In case you're not aware, Desmos is a free and amazing online graphing calculator students can use to explore mathematical ideas for themselves, with your guidance. It's a web app as well as an iOS and Android app. Students love it, for good reason.
There's a classroom activity they've created about parabolas here.
You could also just set up a parabola for them to play with, like here, and share the link.
Or if you just want a static figure, use Desmos to create the graph you want, and then take a screenshot. (Students may miss out on a lot with only a static figure, though!)
We embed a lot of Desmos calculators in Hype docs so we can include explanatory text and such and focus students' attention on a particular aspect. This gets a little more complicated, since we're using JavaScript on the backend to change things as we work our way through the doc, but if you're curious to explore the possibility I'm attaching a sample doc with an embedded calculator. (You're free to use their API to embed like this; their instructions are here.) You'll only see a blank box in Hype, but when you preview in a browser the fully functional calculator will appear.

If you don't want students to see (and hence be able to change) the Expressions list on the left, then in in the Hype doc go to the tab labeled 'loadCalc' and change line 7 from
expressions: true
to
expressions: false
Desmos-in-Hype.zip (96.3 KB)
4 Likes
BruceB
You're free to use their API to embed like this
thank you for giving me another way for my wish! What a great API this is ! And it doesn't look too difficult to embed just simple quadratic function(not so about complicated ones, of curse) I try this too.
1 Like
MaxZieb
Simple template here:
Let me ask something about the sample you showed me.
In that hype document, there were input text box, slider, canvas, number type input.
How can I add them to hype doc?
thanks.
thank you for these interesting samples.
I think I should work on them to bost my skill, too.
Inner HTML editing is done like this:
1 Like
oh HTML itself.
thank you very much.
You’ve been a big help
Now I start to dig into the sample that you shared with me.
And I want to change the range of slider for "b".
According to the explanation for Desmos API, I should implement the following.
calculator.setExpression({
  id: '3',
  sliderBounds: { min: -50, max: 50, step: 1 }
});
Then I think I have to put this in the Hype document function "init( )".
and
the appropriate place to put it seemes to be here ...
b = [ { name: 'loadCalc', source: '[ here ]' }
But it didn't work.
if possible, I want you to help me do this.