Hello fellow Hype-User,
Desperate times need good information to keep people in the loop and fight fake news. Here is a great repository to help you choose the right graph to visualize data.
Hope this helps!
This repository …
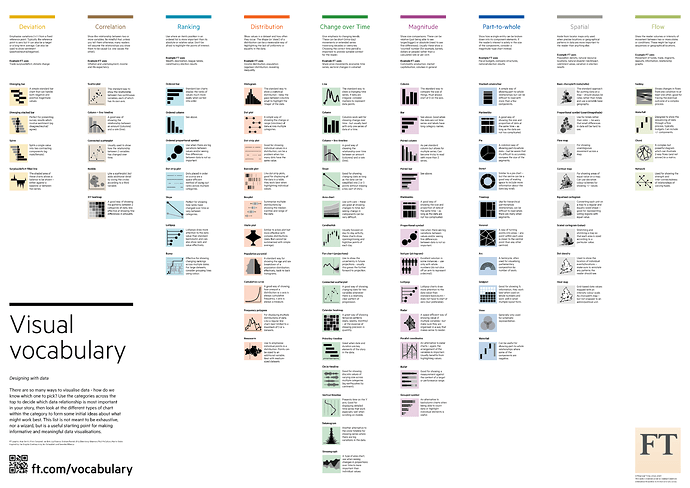
… contains this very helpful poster (overview) to pick the ideal graph for your data:
The FT Visual Vocabulary is at the core of a newsroom-wide training session aimed at improving chart literacy.
