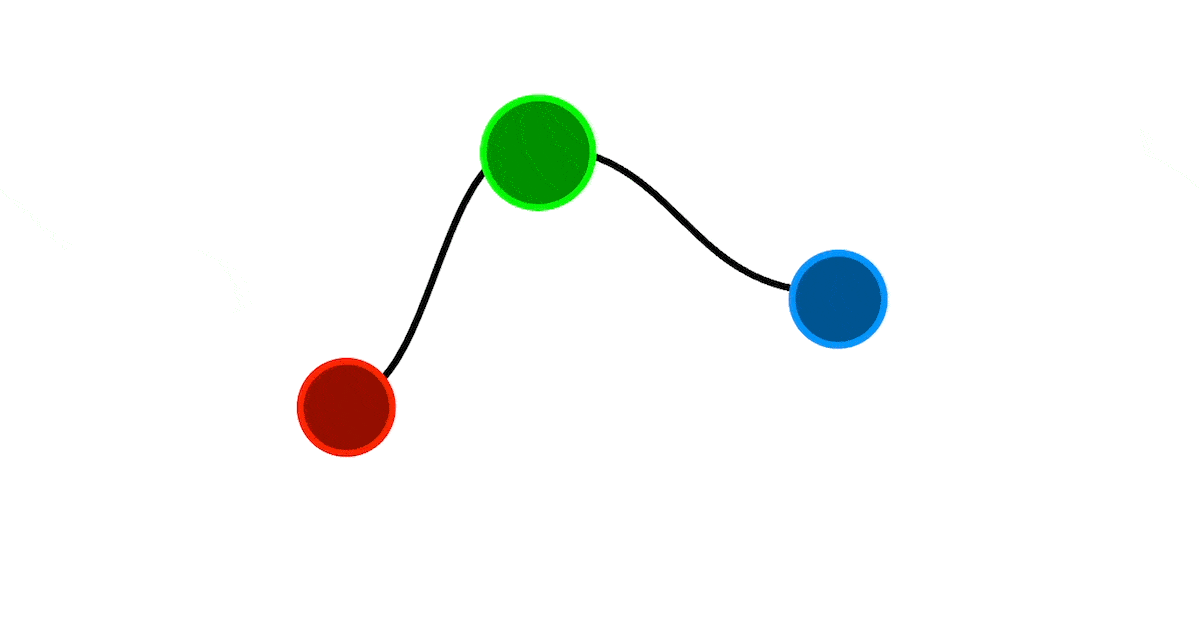
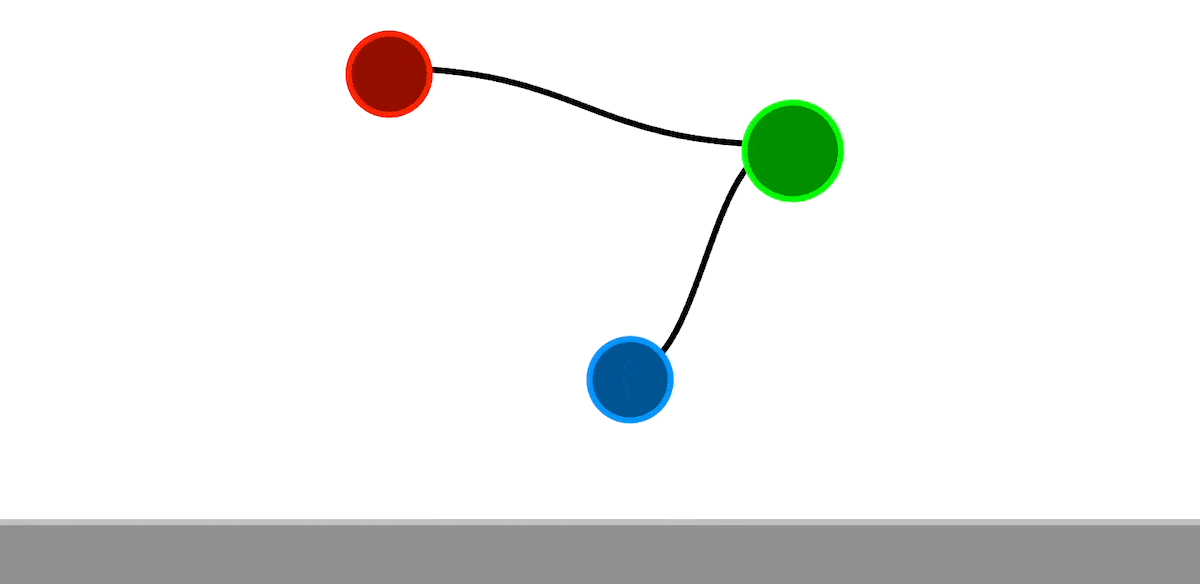
Use this connectWithLine function instead:
hypeDocument.connectWithLine = function(a, b) {
	var a_id = a.id;
	var b_id = b.id;
	var svg_id = a_id + "_" + b_id;
	var svg = document.getElementById(svg_id);

	if (!svg) {
		svg = document.createElementNS("http://www.w3.org/2000/svg", "svg");
		svg.setAttribute("id", svg_id);
		svg.setAttribute("width", "100%");
		svg.setAttribute("height", "100%");
		svg.setAttribute("style", "position: absolute;");

		var path = document.createElementNS("http://www.w3.org/2000/svg", "path");
		path.setAttribute("id", svg_id + "_path");
		path.setAttribute("fill", "none");
		svg.appendChild(path);
		a.parentNode.closest('.HYPE_element').appendChild(svg);
	}

	var path = document.getElementById(svg_id + "_path");
	var hP = hypeDocument.getElementProperty;

	// Get element rectangles
	var a_rect = {
		left: hP(a, 'left'), top: hP(a, 'top'),
		width: hP(a, 'width'), height: hP(a, 'height'),
	};
	var b_rect = {
		left: hP(b, 'left'), top: hP(b, 'top'),
		width: hP(b, 'width'), height: hP(b, 'height'),
	};

	// Calculate connection points
	var a_x = a_rect.left + a_rect.width / 2;
	var a_y = a_rect.top + a_rect.height / 2;
	var b_x = b_rect.left + b_rect.width / 2;
	var b_y = b_rect.top + b_rect.height / 2;

	// Calculate curve control points
	var delta_x = Math.abs(a_x - b_x);
	var delta_y = Math.abs(a_y - b_y);
	var c_x = a_x + delta_x / 2 * (a_x < b_x ? 1 : -1);
	var c_y = b_y + delta_y / 2 * (a_y < b_y ? 1 : -1);

	// Create path
	var d = "M" + a_x + " " + a_y + " C " + c_x + " " + a_y + " " + c_x + " " + b_y + " " + b_x + " " + b_y;
	path.setAttribute("d", d);

	// Apply customization from data attributes (hierarchy: a -> b -> defaults)
	var getDataAttribute = function(attr, defaultValue) {
		return a.dataset[attr] || b.dataset[attr] || defaultValue;
	};

	// Line styling attributes
	path.setAttribute("stroke", getDataAttribute("colorLine", "red"));
	path.setAttribute("stroke-width", getDataAttribute("widthLine", "2"));
	path.setAttribute("stroke-dasharray", getDataAttribute("dashLine", ""));
	path.setAttribute("stroke-linecap", getDataAttribute("capLine", "round"));
	path.setAttribute("opacity", getDataAttribute("opacityLine", "1"));
}
This gives you the following options. You can put them either on a or b of your line pair.
Available Data Attributes:
data-color-line
Line color (default: "red") - Any valid CSS color value
data-width-line
Line width (default: "2") - Numeric value for stroke thickness
data-dash-line
Dash pattern (default: "" - solid line) - SVG dash array like "5,5" for dashed or "10,5,2,5" for complex patterns
data-cap-line
Line cap style (default: "round") - SVG line cap: "round", "square", or "butt"
data-opacity-line
Line opacity (default: "1") - Decimal value from 0 (transparent) to 1 (opaque)