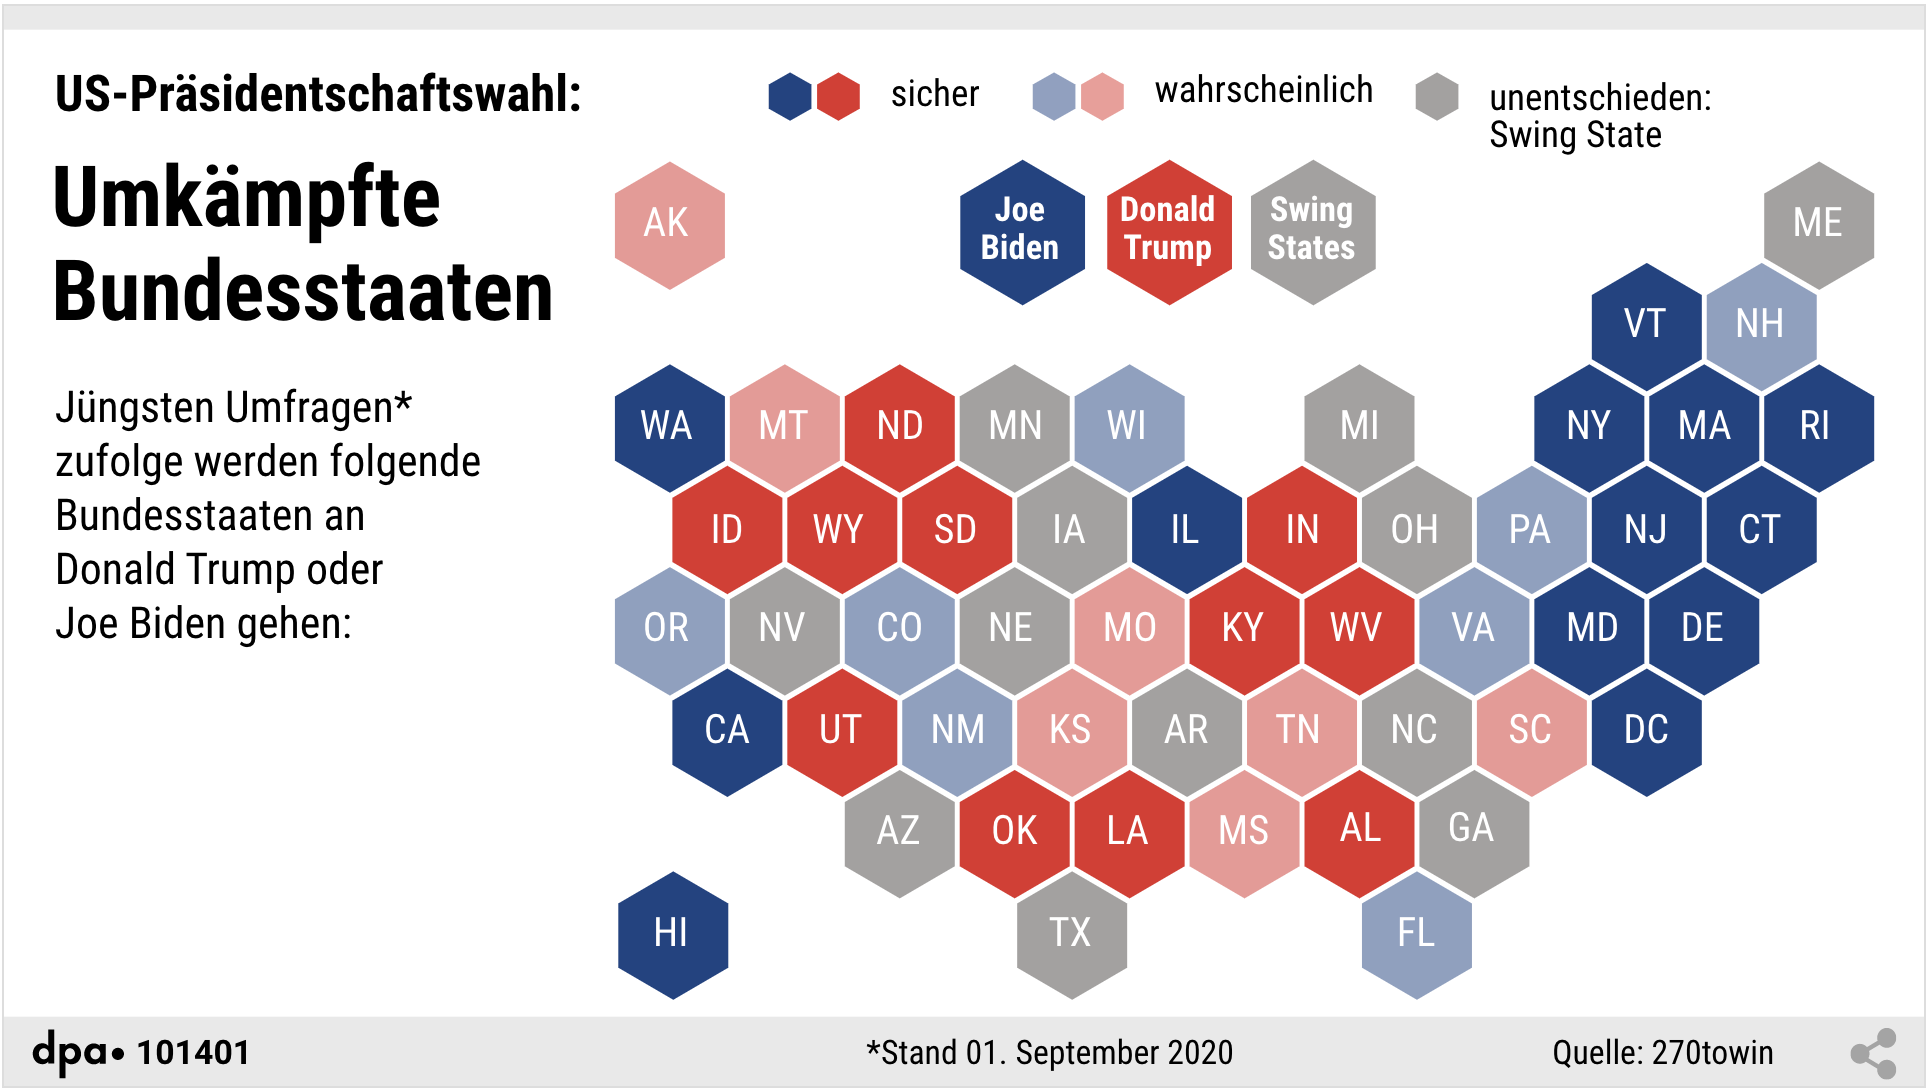
Hi all. This 'map' is based on the '2020 Electoral Map Based on Polls' (270towin.com). Since I have no dynamic data feed, I use a very usefull tool: visualping.io Visualping monitors webpages of your choice and reports changes via mail (changes in text or visual compare). You can even select parts of the page (in this case the map) to be monitored. So I can update my infographic whenever I receive a respective mail. May be, this tool is interesting for you, too.
UPDATE: Old example download removed as the source has evolved
While putting, it together I first used fetchData to have live data but I realized that still needs some work done. I might even take it out and leave it to the user to manage remote data. This now uses hard-coded data as a JSON datastring but that could be updated from time to time using the PHP approach.
Thanks Max for this. Please help me: What actually is the advantage of using HypeDataMagic? Is there a description/documentation available of what it does in detail? In my map I do the coloring via HTML-attributes - so does HypeDataMagic. So - if I had set up a json-feed it would need just a few lines of code to do this.
The main advantage is that the coloring is connected directly to the JSON you parse and set. About the documentation: There is currently non as I was refactoring code but then had some client work. In general I will simplify it as much as possible and remove some things to really have the core version be as sleek as possible.
Basic concept is that you can use the data-magic-key to define the connected data point. So, first you set some data and then you directly link it. The benefit being it is updated immediately when you change the data. And if you use handler like in this example you even get a live preview in the Hype IDE.
 I´ll ask them for assistance.