Hello,
I don’t have any coding experience but I want to make an interactive map that will display text info for cities upon a mouse click or touch for mobile. I have the map and cities as a SVG. My first question is will this require just one scene or do I need to create a scene for each city? The map has dots for the city locations which I want to animate and display text. Do you create layouts for different sizes to make it responsive at the end or do you do it at the beginning with the first scene? Do I have to scale up the map for the different sizes or will that happen automatically?
I’ve watched the tutorials, but I need help at a more basic, beginning level.
Thanks
1 Like
Hi Beth,
I have an example that may be close to what you’re describing (not a very creative site, but it’s what the client wanted): http://berger-engr.com/
The cities have popup boxes with text info that show up on rollover (on desktop & laptop) or touch (tablet or phone). This is all done with JavaScript in one scene. The text is pulled from JavaScript arrays and placed in one popup box that is moved around the map depending on which city is selected.
You can potentially do this without JavaScript by using multiple timelines but you’ll have to first hide other cities’ popup text whenever a new city is selected. If you have lots of cities, this could become cumbersome with timelines.
Regarding RESPONSIVENESS, the example site above uses an older method to resize the entire Hype div (it was created several years ago). Hype now allow you to group your elements (map, city buttons, text, labels, etc. ) into one group then designate the Hype file as being SCALABLE (in the Scene Inspector) and then ZOOM CONTENTS for the group under SCALE BEHAVIOR, under FLEXIBLE LAYOUT, in the Metrics Inspector.
As with all scalable content, on very small screens like phones the city buttons may be too small to touch easily and the text may not be easily readable (as is the case with the site above). You can use Hype’s layouts to create a layout for small screens that makes the text more readable, but with a map I’m assuming that the entire map needs to scale and fit on the screen and custom layouts may not be the answer in your case.
I hope this helps. If you need more detail, let me know. ~ John
2 Likes
John,
Wow! Thank-you so much for that really helpful and well explained response. I will try my project again with all that new information and the example you sent and I’ll see how far I can get! Again, thanks so much.
Beth
You can create a timeline with the reveals for the various cities starting on the second, with a timeline pause at the 29th frame. For each city on the map place a transparent object and set it to jump to the corresponding time in the reveal timeline and play. Another method is to set the city name to fade in and pause on mouseOver, then continue in reverse on mouseOut. In the example, I ended east step at the :29 mark and killed the visibility on the following frame.
RevealCity.hype.zip (11.3 KB)
Thank-you Trey,
I don’t immediately understand this, but I will try this and thank-you for the example.
Sincerely,
Beth
An action is created for the invisible object placed over city 1. When the mouse moves into the area of that invisible object, the Mouse Enter action tells the reveal timeline to jump to the start and begin playing, changing the opacity of the city 1 name from 0% to 100%. When the time reaches frame 29 it hits the timeline action that pauses the timeline. A second action - Mouse Leave - tells the reveal timeline to play backwards, causing the city name to fade to 0%.
For each city, create an invisible object with a similar action, along with a text object for the name of the corresponding city. The difference is that each points to a different point on the reveal timeline. If you drag the time cursor in the reveal timeline, you will see how each of the two city names fades in and out.
Thank-you again, I understand
Beth
Hi John,
Is there any way you could share the file / javascript you used to accomplish this interactive map? I’m attempting to tackle a similar challenge and would appreciate any examples you could offer.
Thank you!
Nathan
Hi Nathan,
I’m traveling this week and don’t have access to the files. If you can wait until next week I may be able help. Please remind me next week if you’re still needing help.
Best … John
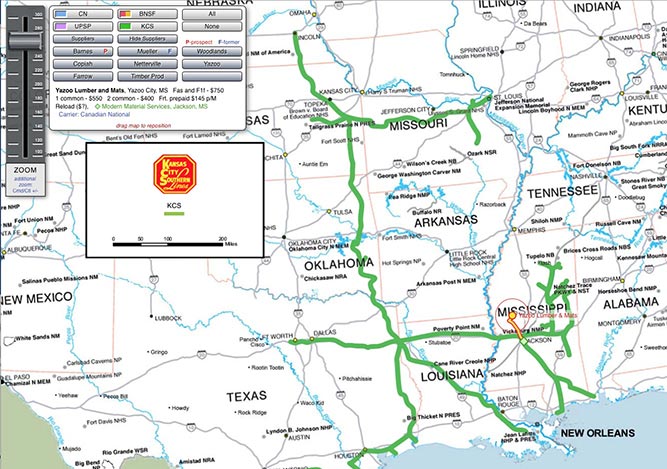
Here’s an interactive map of lumber vendors and rail routes. I can’t share the file for business reasons, Certain elements of the UI are not all that great, but I was given specific instructions.
Notes:
– The button panel is floating and fixed, as is the zoom slider. The map can be dragged and repositioned.
– Each vendor is represented by a group of objects - text, text ghost, location, railway transfer location, and highway route to the railway pickup point. The route scales along with the map and the location points also adjust positions according to scale.
– The railway routes are PNGs. After being laid out in Photoshop, the routes were duplicated, with one layer set to darken and the other being solid but manually erased where it overlapped a name on the map. The two were combined with the background and isolated - knocking out everything but the shape of the route. Each was output as a PNG that aligns precisely with the map in the background — one PNG for each railroad.
– The routes are controlled by keyframes on a dedicated timeline. This was set up with the visibility for various routes being laid out at one second intervals. For example, if you want to see the Burlington route, apply a mouse action to the Burlington button that sends the railway timeline to the one second position. There is also a position on the timeline where all are visible and another where none are visible. The vendors have their own timeline, which works the same way.
– In addition to the map content, the navigation panel also has items that are controlled by timeline. When you click on a button for a certain vendor, info for that supplier is displayed at the bottom of the navigation panel. This is handled by the same timeline that handles the map content for all the vendors.
I have used this same approach for a rather extensive FAQ system that works at multiple levels: topic, subtopic, question and answer. At that level, editing becomes painful as you have to line up the time cursor for each active timeline to display what you want, then turn off any overlapping content to be able to edit the text.
Check out the “tour” animation on the home page at http://mobile.lightbenders.com. This involves multiple scenes where elements are turned on and off either by selecting something from a list or by triggering a timeline. Depending on the scene and content, there are up to six timelines being used to control the action. Adding to the fun, the the layouts are relative and responsive.